



Skip to content
Showhub

Event Management Platform

Driving a 65% Increase in Event Registrations & Boosting Ticket Sales by 49% Through UX Redesign

Product Design

Client
Showhub
Industry
Event Platform
Service
Product Design
Team Setup
2 designers, 3 Developers, 1 Project Manager
Timeline
6 Months

Context

ShowHub is a technology-driven platform designed to transform the exhibition experience for visitors and exhibitors through advanced ticketing, networking, and showcase management. Despite its strong feature set, our UX audit revealed key usability and engagement gaps — limited exhibitor content, weak online-to-offline integration, and event-specific restrictions reducing long-term connections. As business focus shifts toward physical events, these challenges hinder user satisfaction and platform adoption. This case study presents findings from usability testing, competitive analysis, and user research, leading to actionable design solutions aimed at creating a more seamless, engaging, and scalable event experience.

Objective

  1. Improve the user experience (UX) to make the platform more intuitive, engaging, and accessible.
  2. Convert users from passive registration to active engagement with exhibitors and their content.
  3. Increase exhibitor participation by streamlining workflows and simplifying showcase management.
  4. Enhance the visibility of products, brands, conferences, and sessions.
  5. Drive higher post-registration attendance and overall platform adoption.

User Type

Visitors

Exhibition attendees using ShowHub to discover events, book tickets, and network. They seek easy navigation, engaging content, and seamless experiences but face issues with incomplete exhibitor details and limited interactive features.

Exhibitors

Businesses showcasing products via ShowHub to reach audiences. They manage showcases, leads, and engagement but struggle with repetitive setup, incomplete profiles, and limited post-event connectivity.

Note: Although other user types exist (Admin and Sub-admin), this scope of work focuses solely on Visitors and Exhibitors.


1.Product & Business Understanding

To align with the stakeholders vision and to understand product end to end I did following things:

  1. BRD Brief Meeting
  2. Product Understanding
  3. Stakeholders Interview (CEO, MD, Sales Management Team & Marketing Management Team)
  4. UX Audit - The goal is to identify usability issues, improve user satisfaction, and align the experience with business goals.
  5. Roadmap & Planning (Milestone Planning & Efforts)
  6. Industry Understanding

2.User Research

2.1 Research Goals

  1. Understand user behaviour across the platform to identify friction in navigation, ticketing, and feature discovery.
  2. Analyse why exhibitors leave showcases incomplete and how it affects engagement.
  3. Evaluate awareness and usage of core features like networking, chat, meeting requests, and search.
  4. Identify content gaps, unclear workflows, and UI inconsistencies affecting user satisfaction.
  5. Assess platform challenges during physical events, including ticket access, internet issues, and onsite navigation.
  6. Study exhibitor workflows to streamline multi-event showcase setup and reduce repetitive tasks.
  7. Benchmark Showhub against competitors to uncover missing features and best practices.
  8. Generate actionable insights that guide redesign decisions, improve usability, and increase overall adoption and engagement.

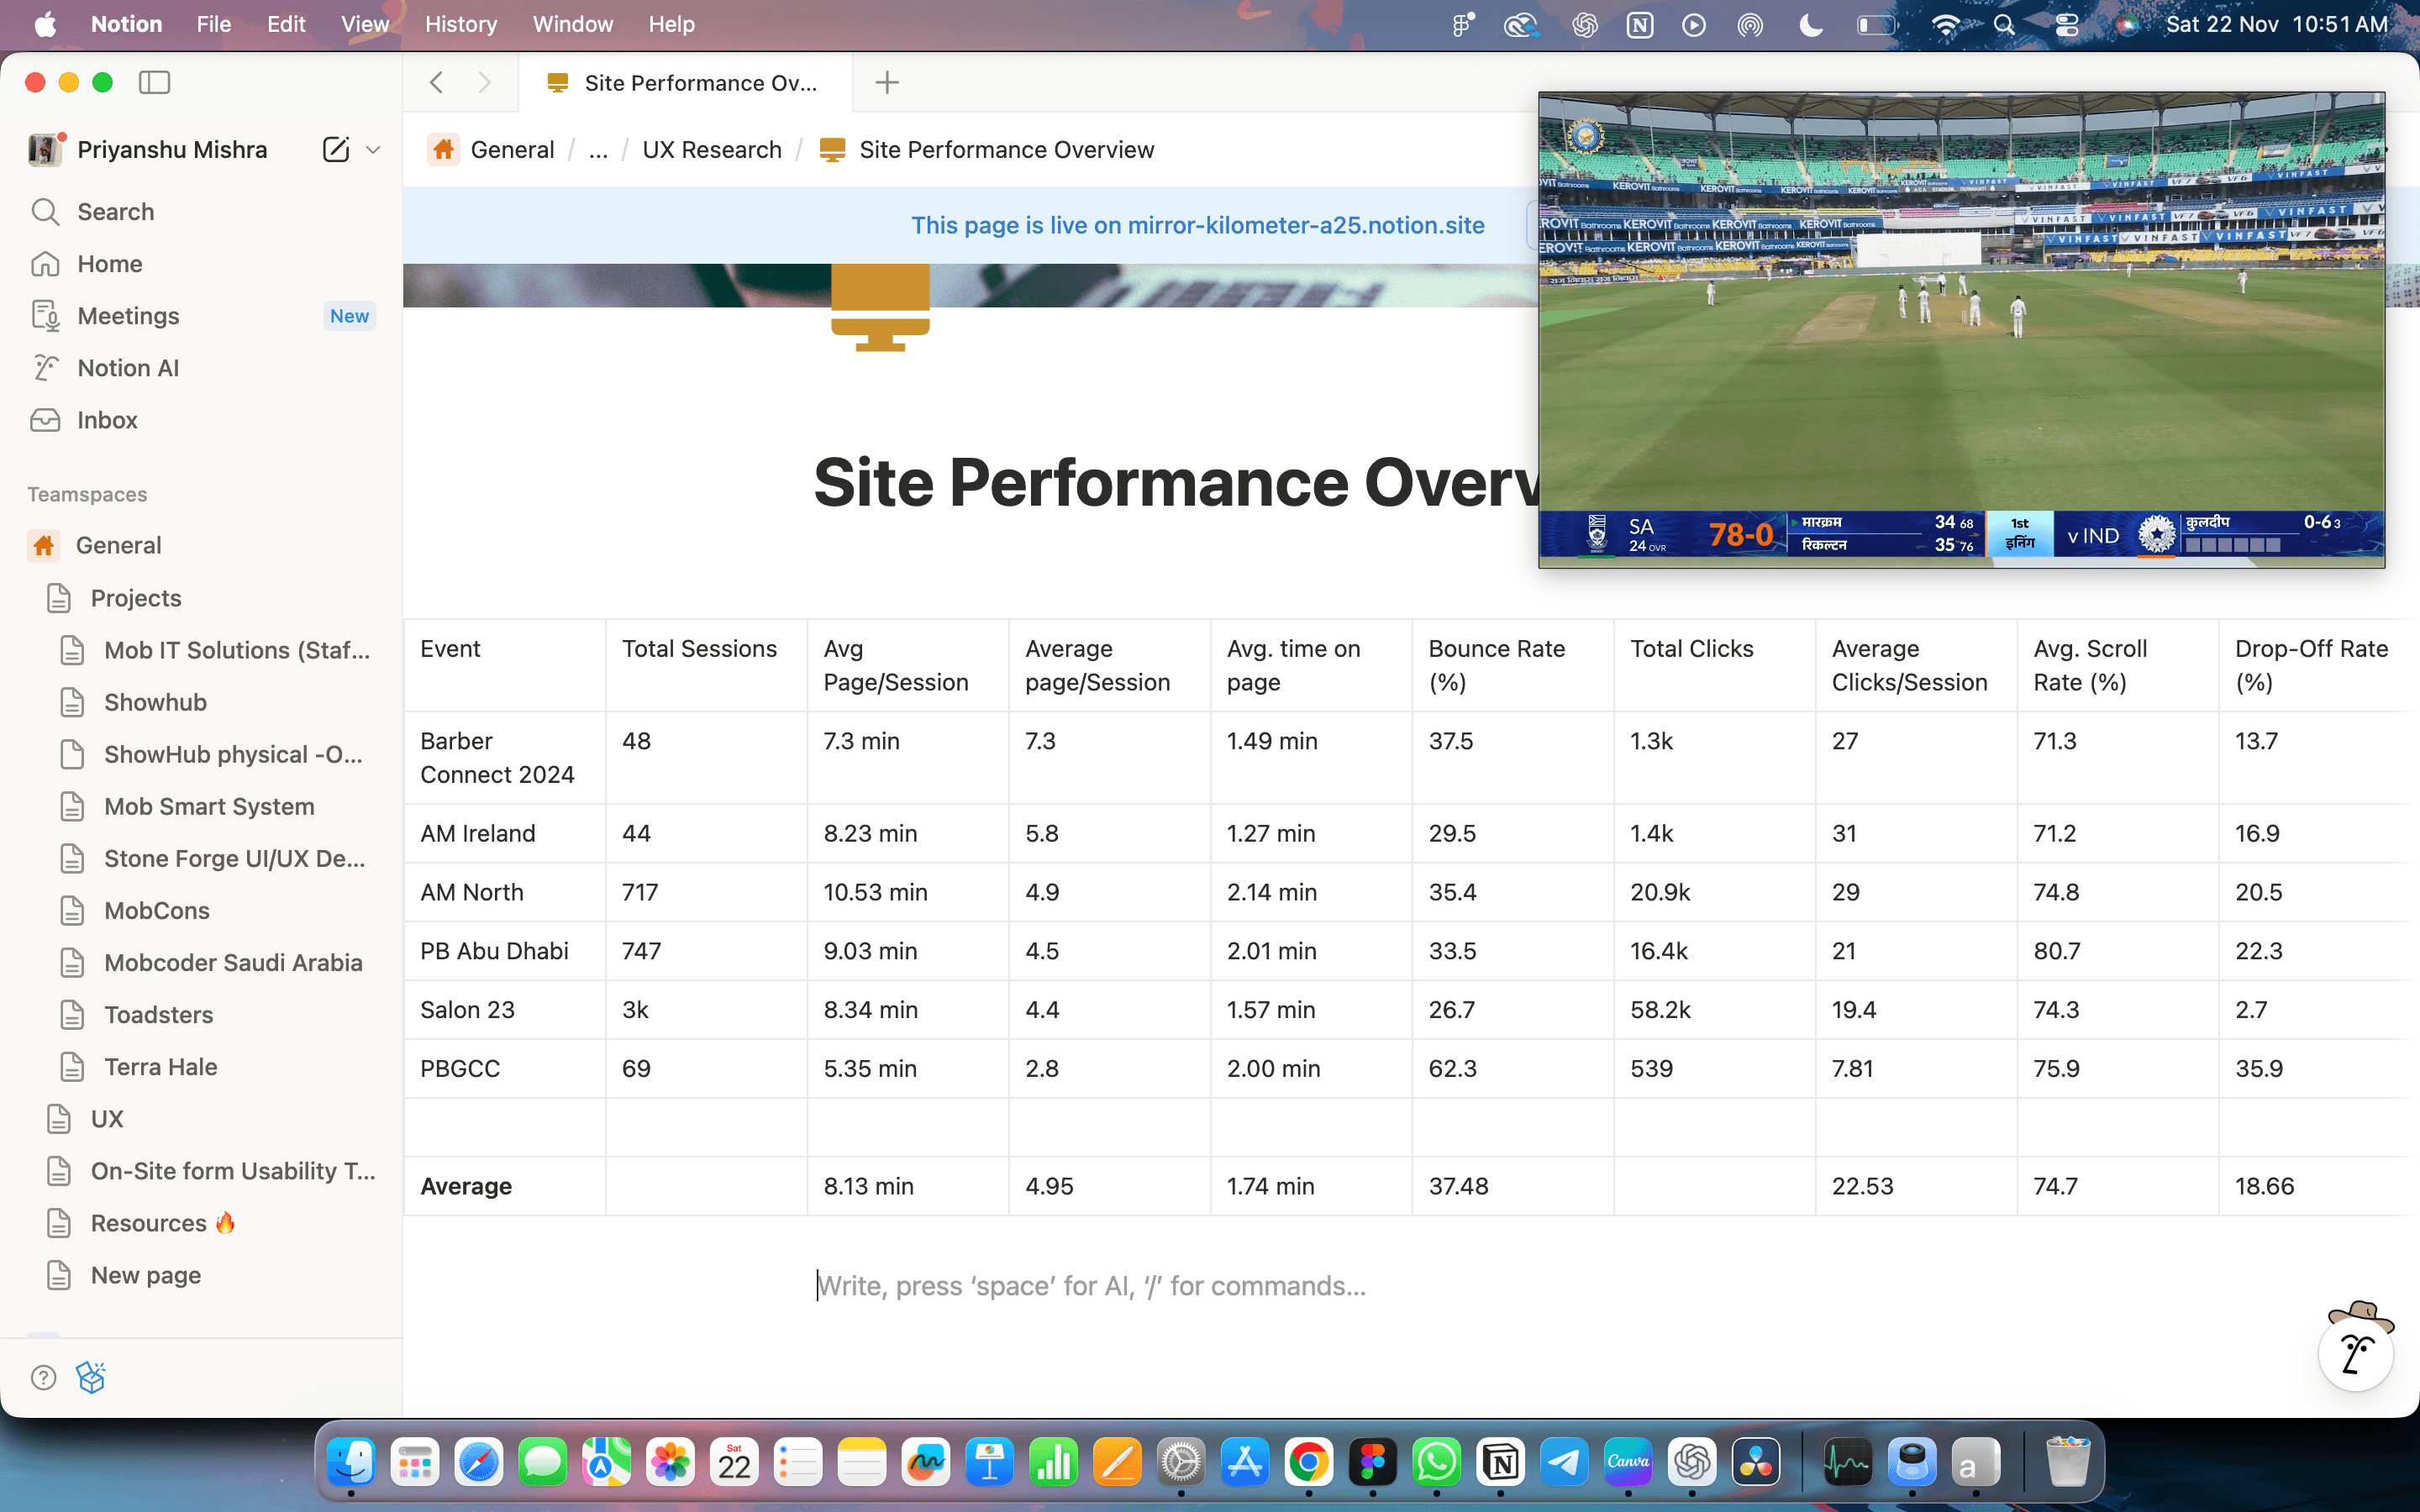
2.2 Site Performance Overview/Analytics (Hotjar)

Hotjar site performance analytics table for Showhub events.

2.3 Competitive Analysis

A competitive benchmarking analysis was conducted to evaluate Showhub's performance against industry peers and uncover opportunities for improvement. By comparing user interface (UI) and user experience (UX) designs, features, and functionality, we identified best practices and gaps to inform strategic enhancements for the platform.

2.3.1 Competitors

  • CDACDC logo
  • See Tickets logo
  • Eventify logo
  • Eventbrite logo
  • CC logo

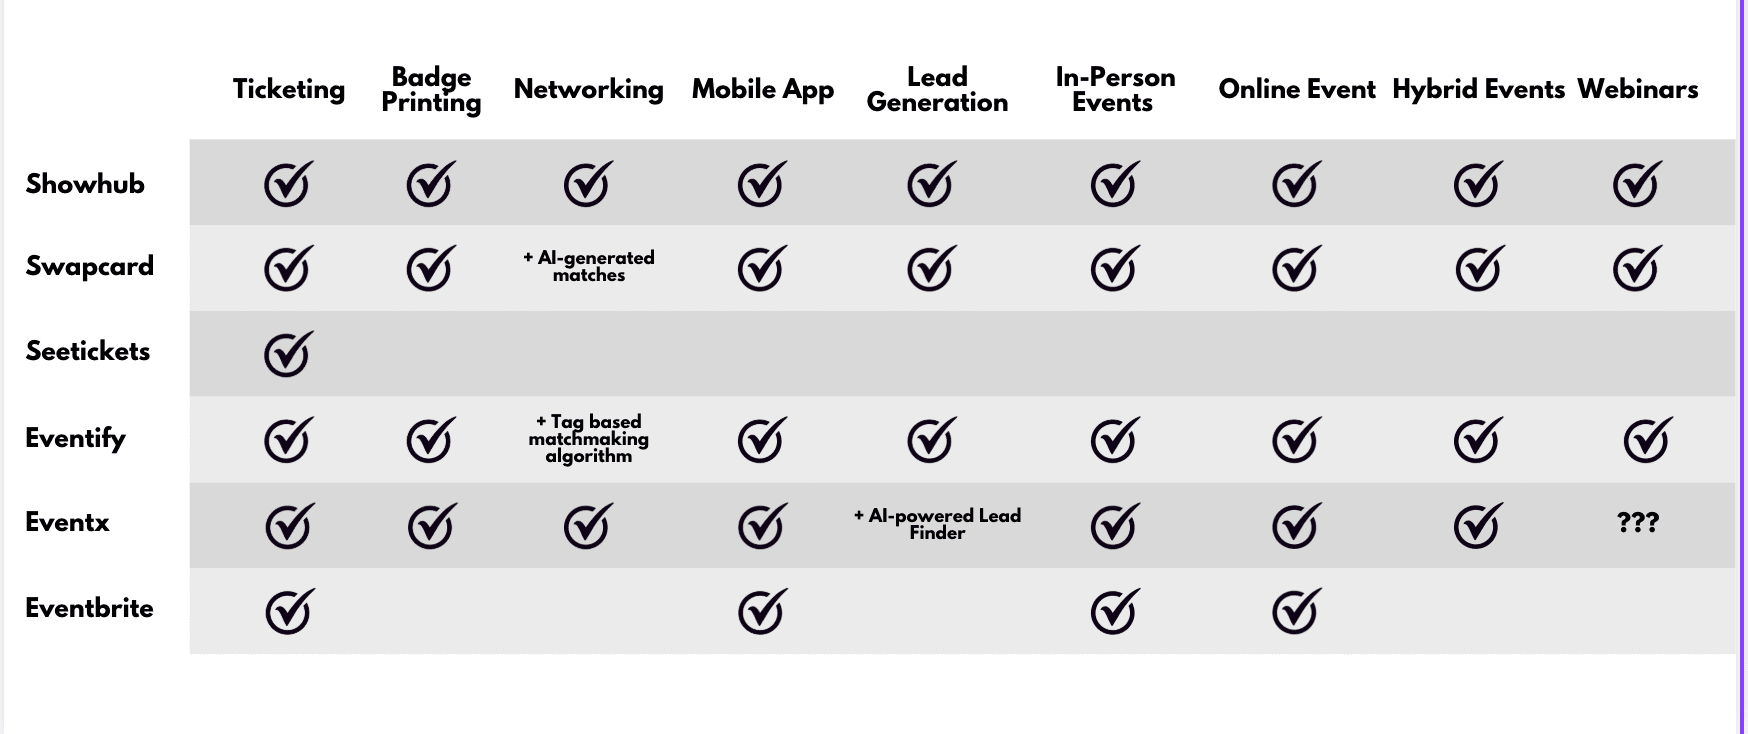
2.3.2 Features Comparison

Features comparison of Showhub, Swapcard, Seetickets, Eventify, Events and Eventbrite across ticketing, badge printing, networking, mobile app, lead generation, in-person events, online events, hybrid events and webinars.

2.3.3 SWOT Analysis

Strengths:
  • We know our market & clients very well.
  • We have a great feature set to add value for exhibitors & visitors
  • Companion app to exhibition is really useful for lead generation
Weakness:
  • Our UI/UX is convoluted leading to users not using Showhub to it’s full potential
  • Lack of landing page is hurting our brand image and trustworthiness
Opportunities:
  • A lot of exhibitions are using very primitive software still and the market is still very open
  • Our software is proven on numerous events now so is ready to push for expansion
Threats:
  • On the surface our competitors look way ahead of us due to our lack of a landing page
  • Massive advance in AI which we are not yet leveraging
  • We need to build out the subadmin side to make it more friendly for exhibitors using the platform
  • No clear pricing plans or monetisation strategy on whitelabelling for other exhibitors

2.3.4 Gatherings/Findings/Results

The analysis reveals that ShowHub has strong features but suffers from complex UX and weak brand presence. Competitors offer smoother usability and clearer value communication. Key findings highlight the need for simplified design, improved navigation, a compelling usability, and strategic feature optimisation to enhance user engagement and market competitiveness.


2.4 Survey - (325 Users)

Visitors (214 Response)

Visitors find the platform easy to use for basic functions but struggle with unclear maps, confusing ticket flows, and incomplete exhibitor profiles. They remain unaware of networking features and often do not interact with exhibitors. The experience feels functional but not engaging, and low content variety furture

Exhibitors (111 Response)

Exhibitors face friction in showcase setup, staff management, and content creation. Due to confusing workflows and repeated work for every event, exhibitors often leave profiles incomplete, reducing visibility and visitor engagement. Networking and lead-generation tools are underused because visitors do not discover them and exhibitors cannot easily access or reuse their data.

2.5 User Interview - (5 Users)

Visitors (3 Interviews)

Visitors found the platform clunky and confusing, especially for exhibitor details and ticket categories. Limited exhibitor variety reduced interest, and unclear navigation prevented meaningful exploration. Networking tools felt hidden or unusable. High event fees restricted student participation. Overall, visitors desired clearer flows, richer exhibitor content, and easier discovery.

Exhibitors (2 Interviews)

Exhibitors faced difficulty completing showcases due to unclear workflows, missing indicators, and poor interface structure. Rebuilding profiles for every event created frustration and reduced content quality. Staff role confusion and low visitor interaction further limited engagement. Exhibitors wanted streamlined setup, mandatory content prompts, reusable showcases, and better visibility across events.

2.6 Usability Testing - (3 Users)

Usability testing was conducted with three participants to evaluate key features of the Showhub platform, including event ticket booking, brand/product navigation, connection tools, and showcase management. While the sample size was small due to challenges in securing volunteers, the feedback provided valuable insights into user challenges, particularly regarding navigation flow, interface clarity, and task completion.

  1. Navigation & Hierarchy Issues: Users found ticket booking, meeting scheduling, and showcase setup confusing due to poor visual hierarchy, unclear flows, and hidden or non-prominent CTAs.
  2. Ticket Clarity Problems: Ticket types were unclear, poorly described, and hard to understand; users struggled to identify what each ticket represented and where booked tickets were saved.
  3. Lack of Feedback & States: Missing toast messages, unclear button states, and inconsistent hover/active interactions caused uncertainty during key actions.
  4. Brand/Product Confusion: Users couldn’t understand how brands/products were linked to the event they booked, due to missing descriptions and contextual information.
  5. Showcase & Company Management Issues: Showcase creation had confusing mandatory field logic, active buttons without validation, and unclear tab behavior; “Manage Company” vs “Manage Showcase” created navigational confusion.
  6. Form Usability Problems: Mandatory fields were not marked properly, leading to frustration while filling forms and uncertainty about which inputs were required.

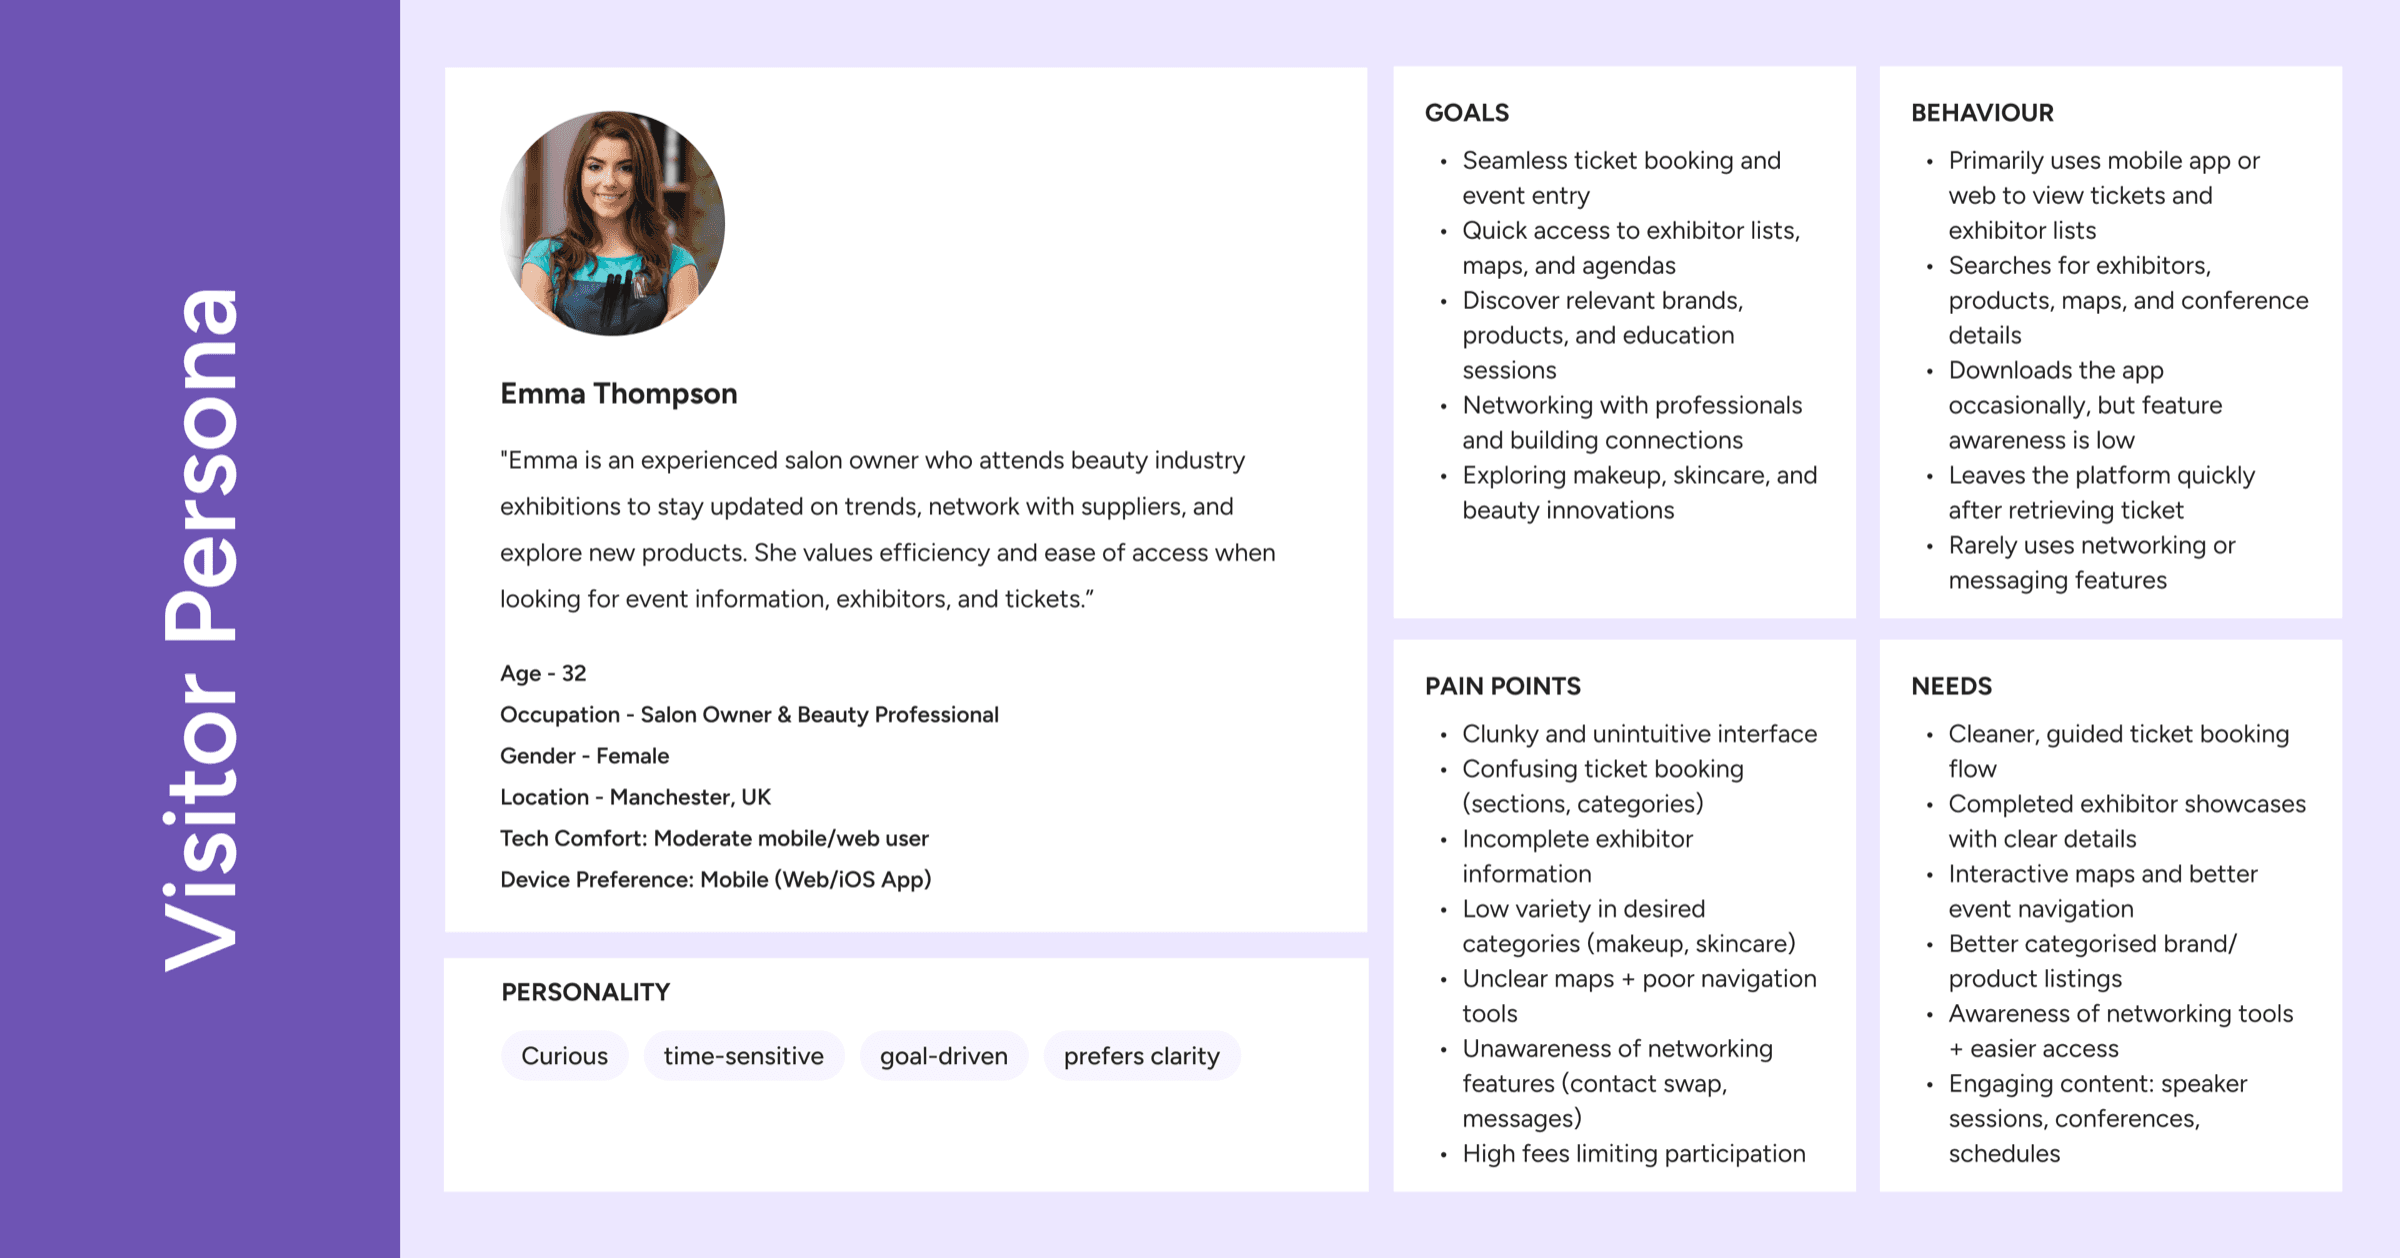
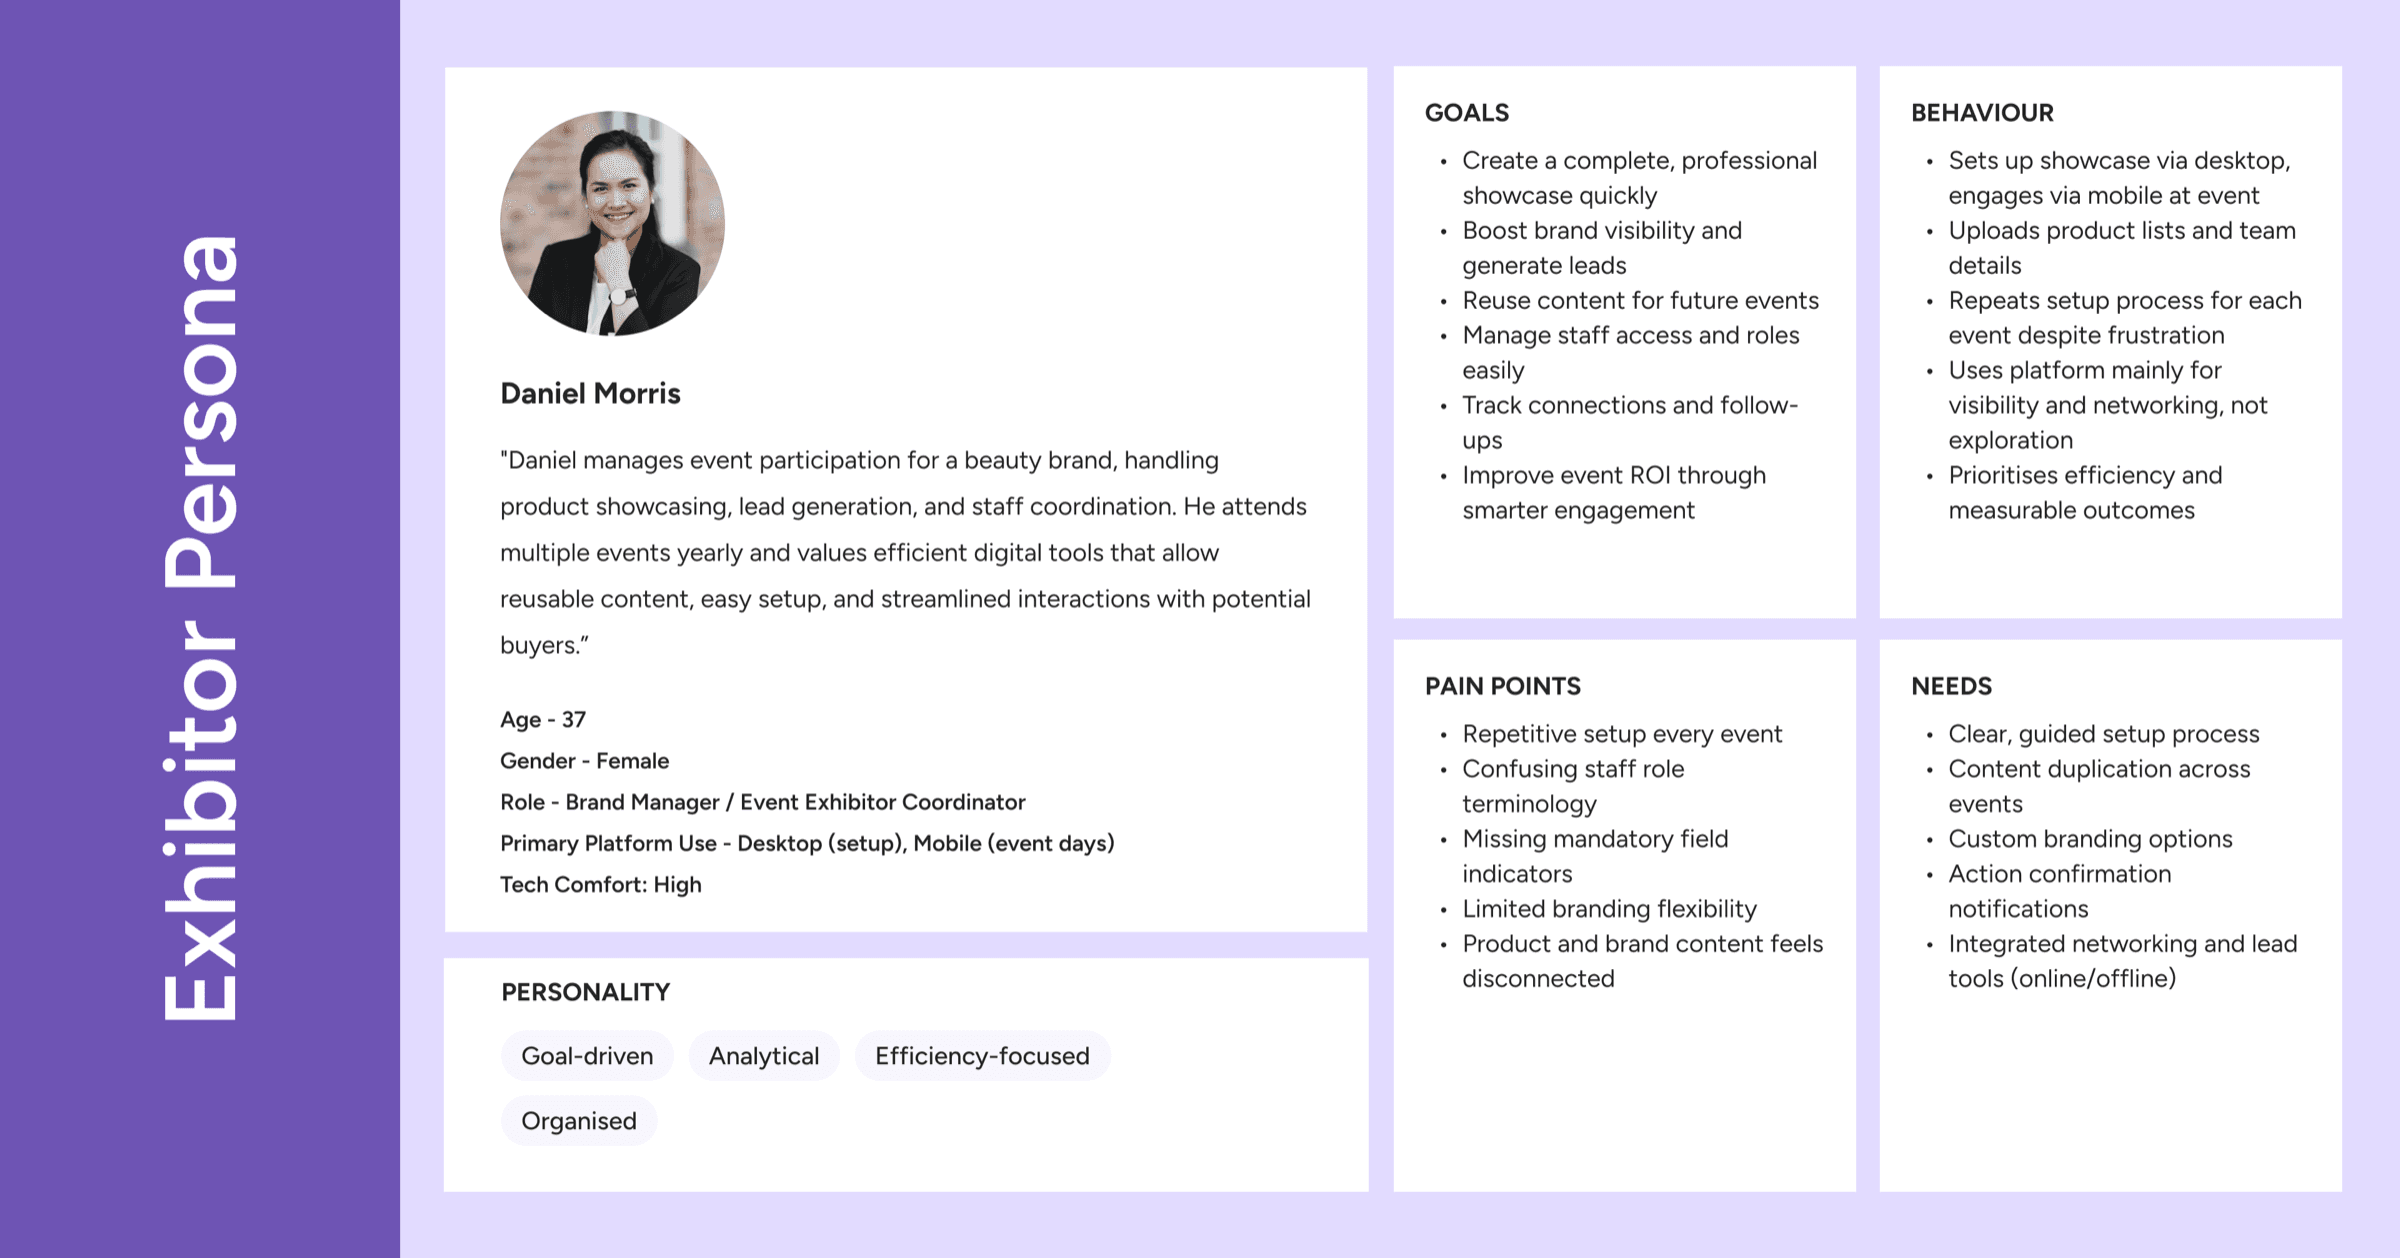
2.7 User Persona

Showhub visitor persona.
Showhub exhibitor persona.

2.8.1 New User Journey (Visitor)

New user journey for visitors
StageUser Milestone / ActionKey System Response / Outcome
DiscoveryLands on event home page (search, social, email)Event home with clear navigation to agenda, brands, registration
Explore Event InfoBrowses agenda, sessions, speakers, brands, products, offersShows structured schedules and featured brands/products/offers
Decide to EngageOpens session / speaker / brand / product detailsDetail pages with CTAs to add to cart, enquire, or wishlist
Registration (Free)Registers for a free event via form/questionnaireRegistration confirmed, digital badge/QR issued
Registration (Paid)Adds paid sessions to cart and completes payment + questionnaireTicket, receipt, and badge/QR issued
PersonalizationCreates account and answers event-related questionsSystem generates personalized sessions, brands, and connection recommendations
My EventViews “My Event” calendar (booked sessions, meetings, suggestions)Central view of user’s event plan and recommended activities
NetworkingConnects via chat/calls/meetings, scans badges at eventConnections recorded and accessible in networking list
Engagement ToolsUses wishlist, floor map, search, and Discover videosEasier planning, navigation, and discovery of relevant content
Post-Event Wrap-UpDownloads connection list and sets notification preferencesContact export ready; future event and update notifications set

2.8.2 New User Journey (Exhibitor)

New user journey for exhibitors
StageUser Milestone / ActionKey System Response / Outcome
Onboarding & Setup
  • Signs up or logs in (direct or via admin) and selects a plan.
  • Creates and assigns a showcase to an event, sets email
  • Customizes showcase (banner, logo, features, products, offers, videos)
  • Adds staff, assigns them to events, sets admin access and Person to Contact
  • Exhibitor account is active with appropriate subscription
  • Showcase linked to event with unique email and ready for visitors
  • Showcase content updated and displayed in visitor view / preview
  • Staff profiles stored, permissions set, queries routed to chosen contact
Managing Leads
  • Opens Inquiry List and views inquiry details
  • Responds via chat, email, or phone; exports inquiries
  • System shows list of inquiries and full details per inquiry
  • Communication sent; CSV file generated for offline use
Dashboard Overview
  • Opens Dashboard
  • Reviews engagement and list of interested people
  • Switches between “View as Visitor” and “View as Exhibitor”
  • Overall activity and metrics loaded for that exhibitor
  • Engagement stats and interested visitors displayed
  • Interface toggles between visitor preview and editing mode

Note- Exhibitors will have access to all the features of visitors.


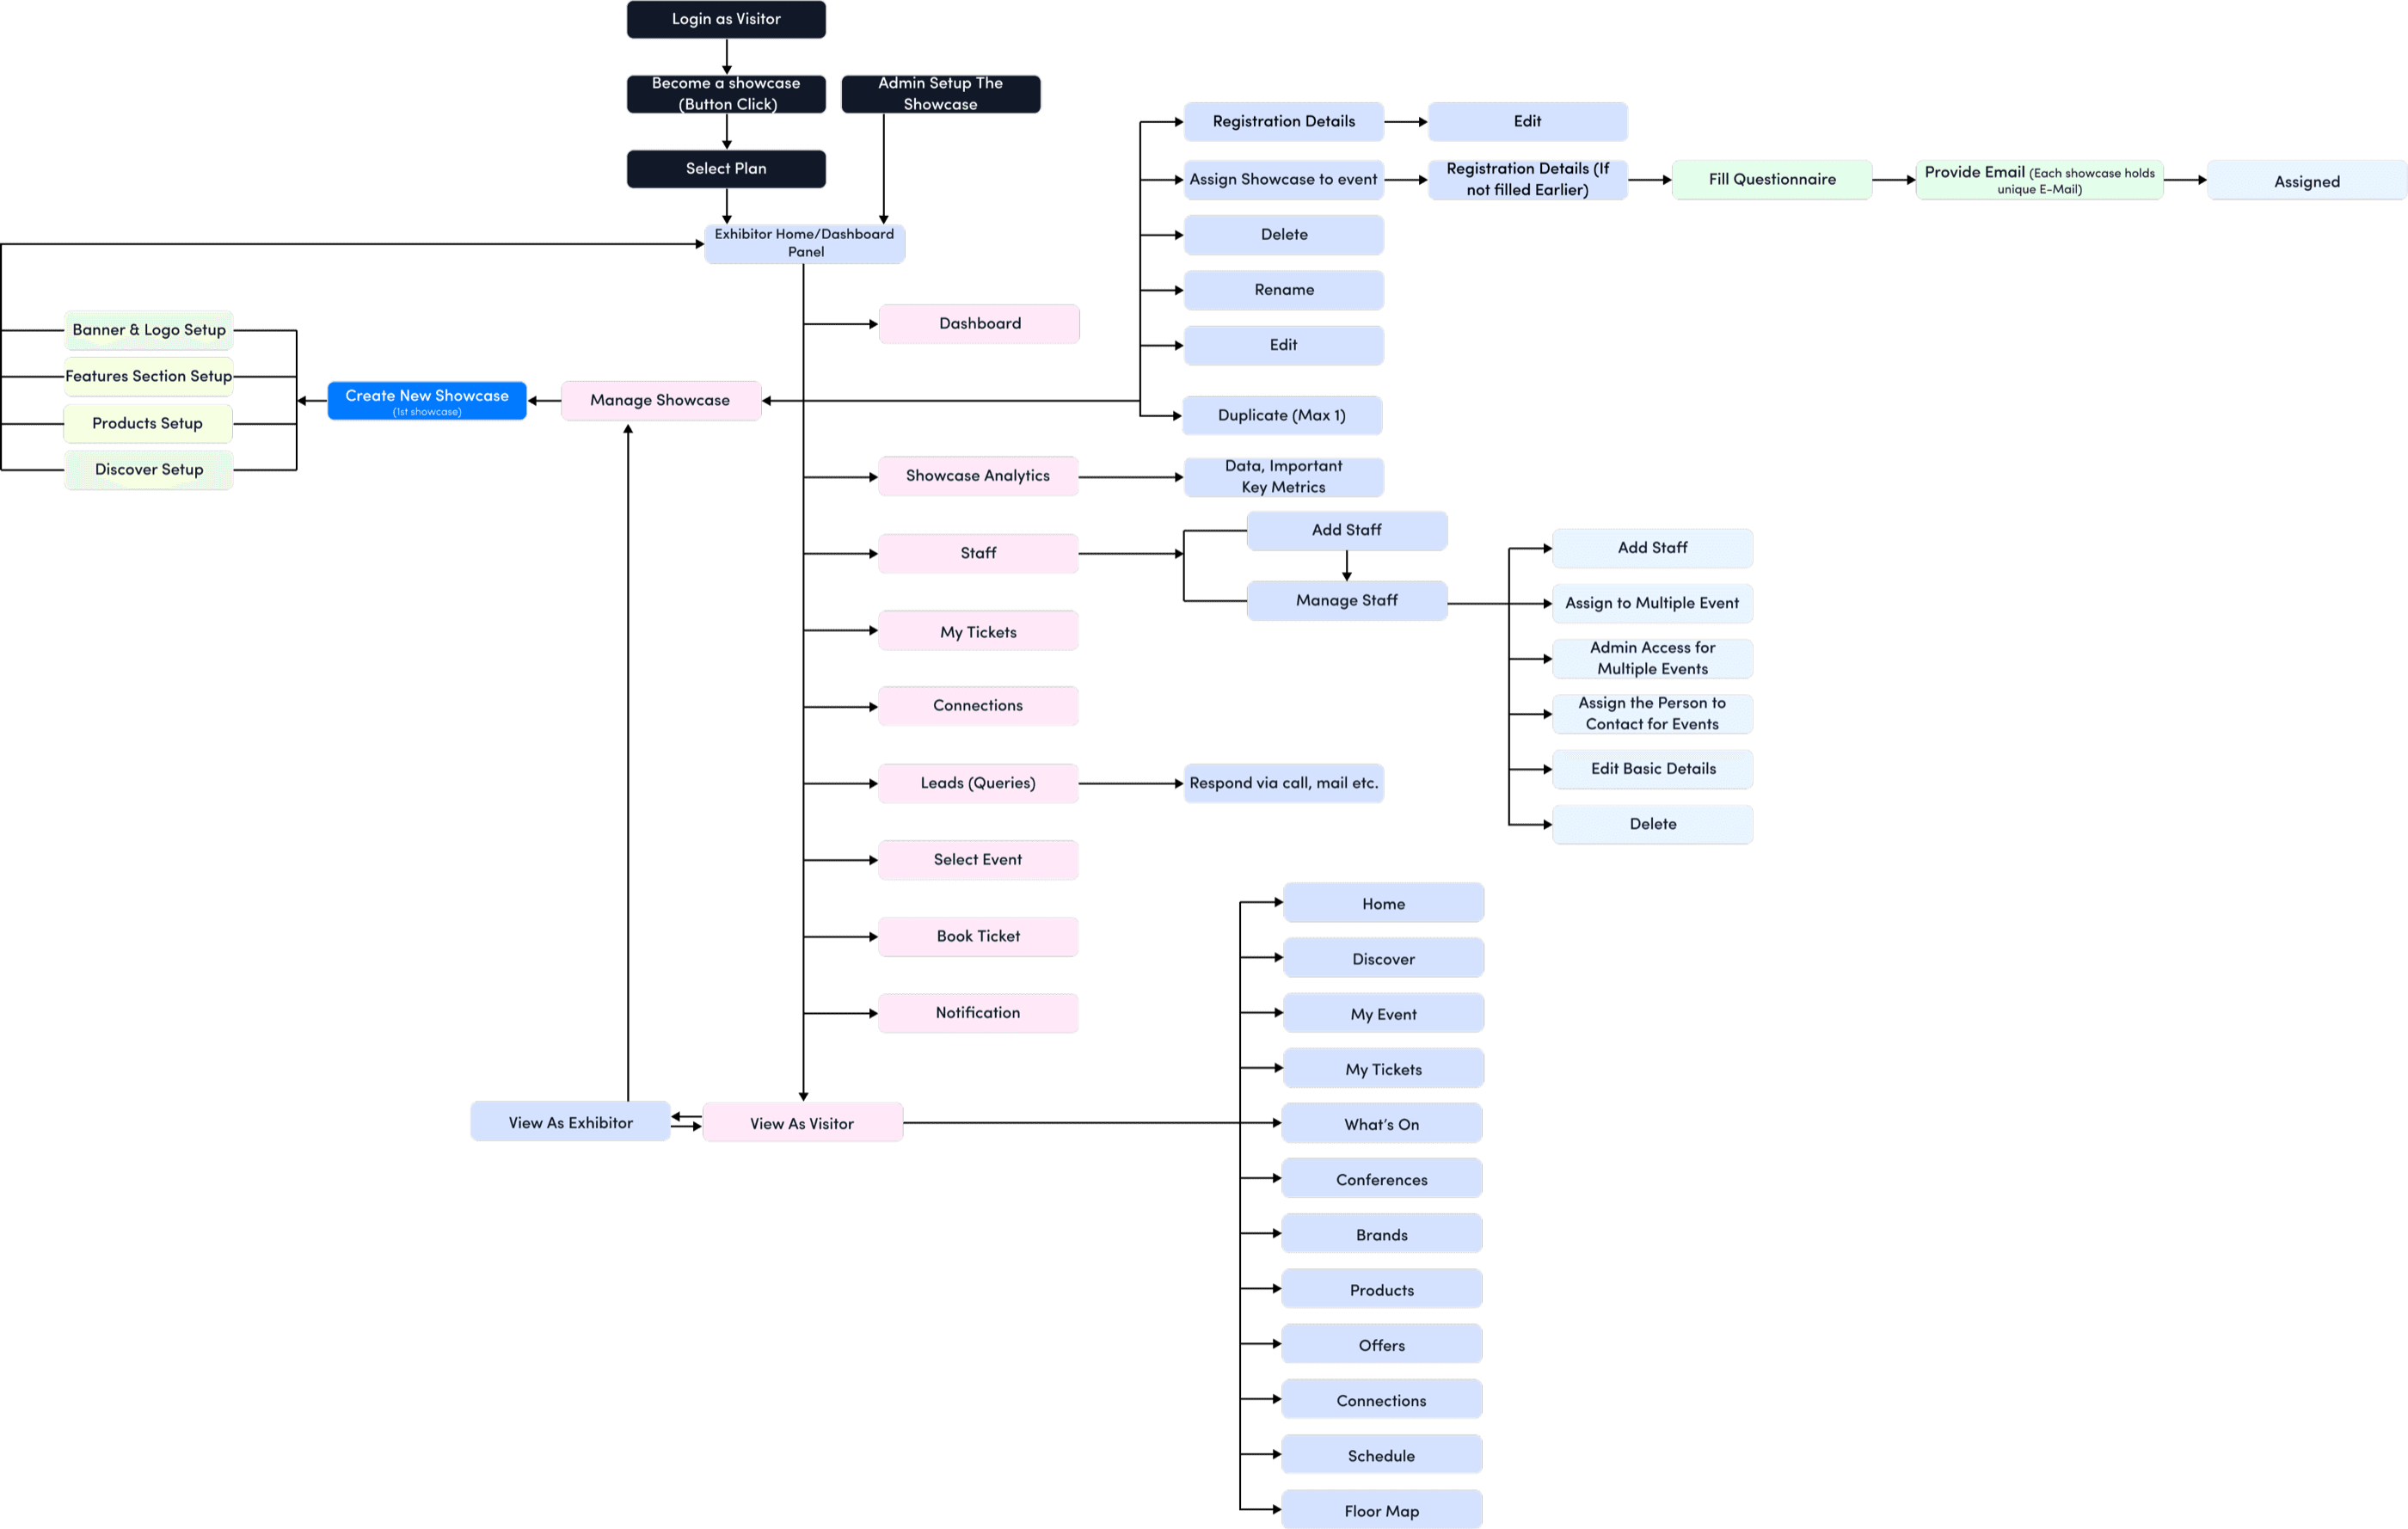
2.9 New User Flow (Exhibitor)

New user flow diagram for exhibitors.

3.Ideation / Sketch / Brainstorming

Once the research was completed, recurring patterns became clear: users weren’t struggling because the platform lacked features—they were struggling because those features were hard to find, unclear, or incomplete. This insight shaped the direction of the ideation phase.

We organised all findings into key problem areas such as navigation, ticket management, showcase completion, feature discoverability, and content quality. From these, we defined guiding design principles: simplify navigation, surface important actions at the right moment, support completion over access, and create one seamless pre-event, onsite, and post-event experience.

Using these principles, we began sketching multiple solutions. Low-fidelity wireframes helped validate user flows, while high-fidelity versions refined clarity, hierarchy, and UI consistency. Quick-win enhancements were prioritised first, followed by larger structural changes such as a redesigned ticket flow, improved search, and a more intuitive showcase setup.

Conclusion:

The ideation phase transformed fragmented feedback into a clear, solution-focused vision. Every design decision was grounded in user insights, ensuring the platform evolved into a more intuitive, discoverable, and engaging experience.


4.Overall User Pain Points, Repercussions & Solutions

1Streamlining Ticket Access & Networking: Save to Wallet, Enhanced Navigation, and QR Code Integration

Pain Points (Tickets)

Users faced difficulties accessing their ticket information, causing delays and inefficiencies at gates.

Repercussions (Tickets)

Delayed access to tickets could lead to long queues, complications during entry, and a negative perception of the platform’s usability.

Solution (Tickets)

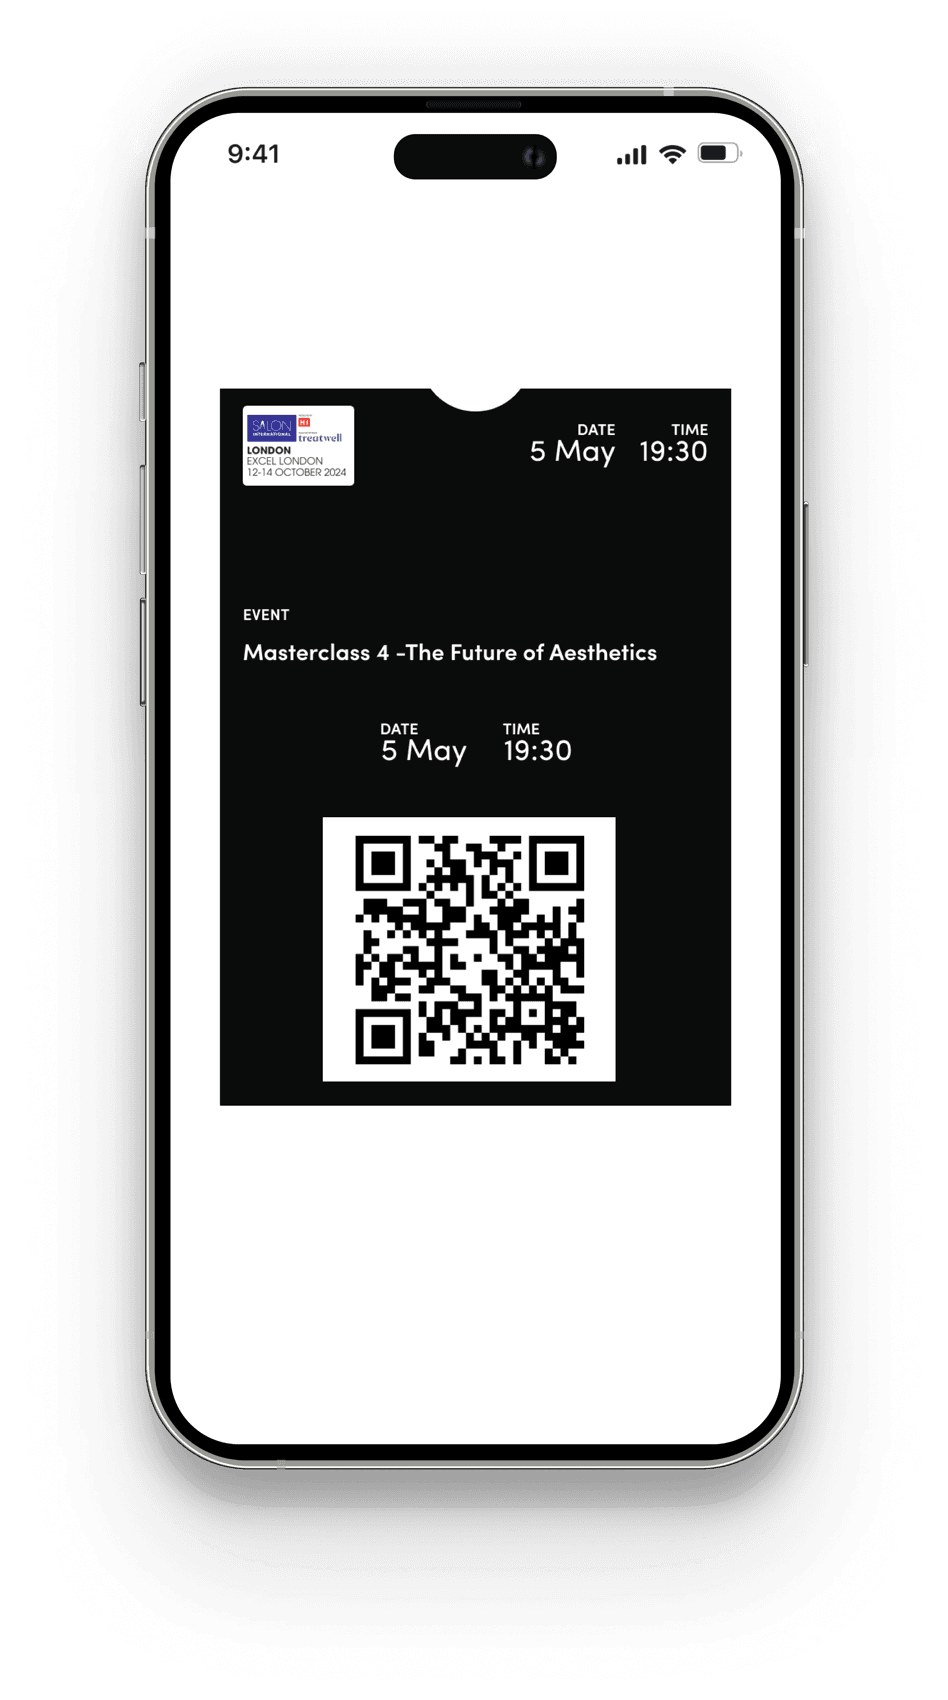
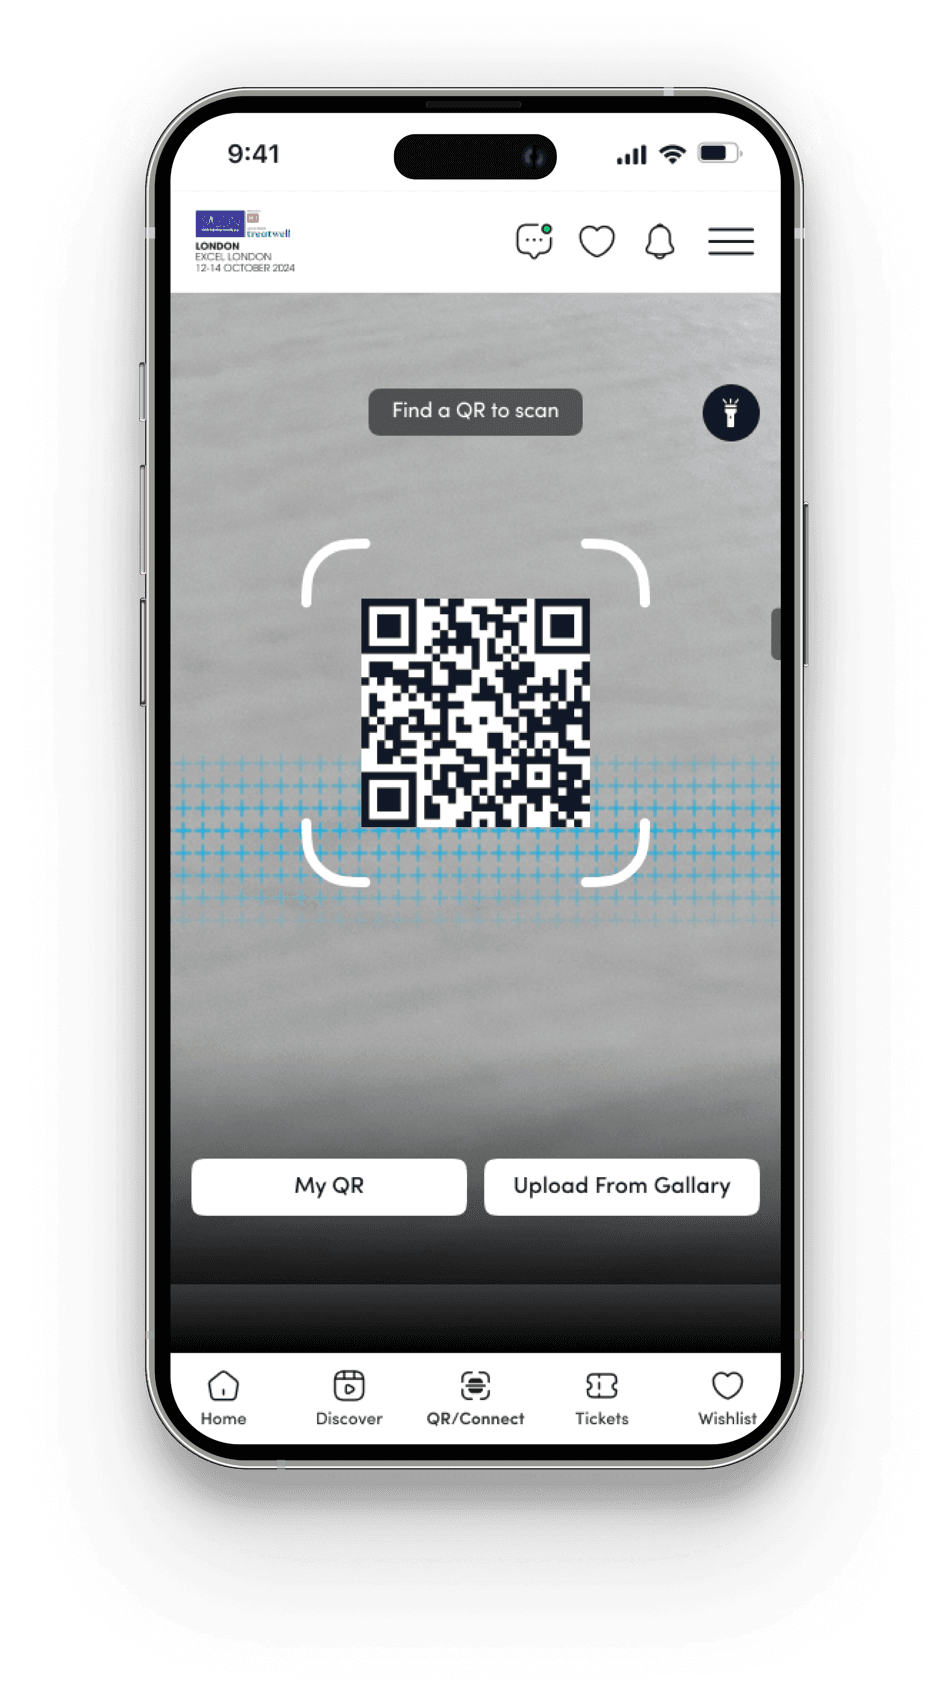
  1. Introducing a "Save to Wallet" feature for quick and convenient access to booked tickets.
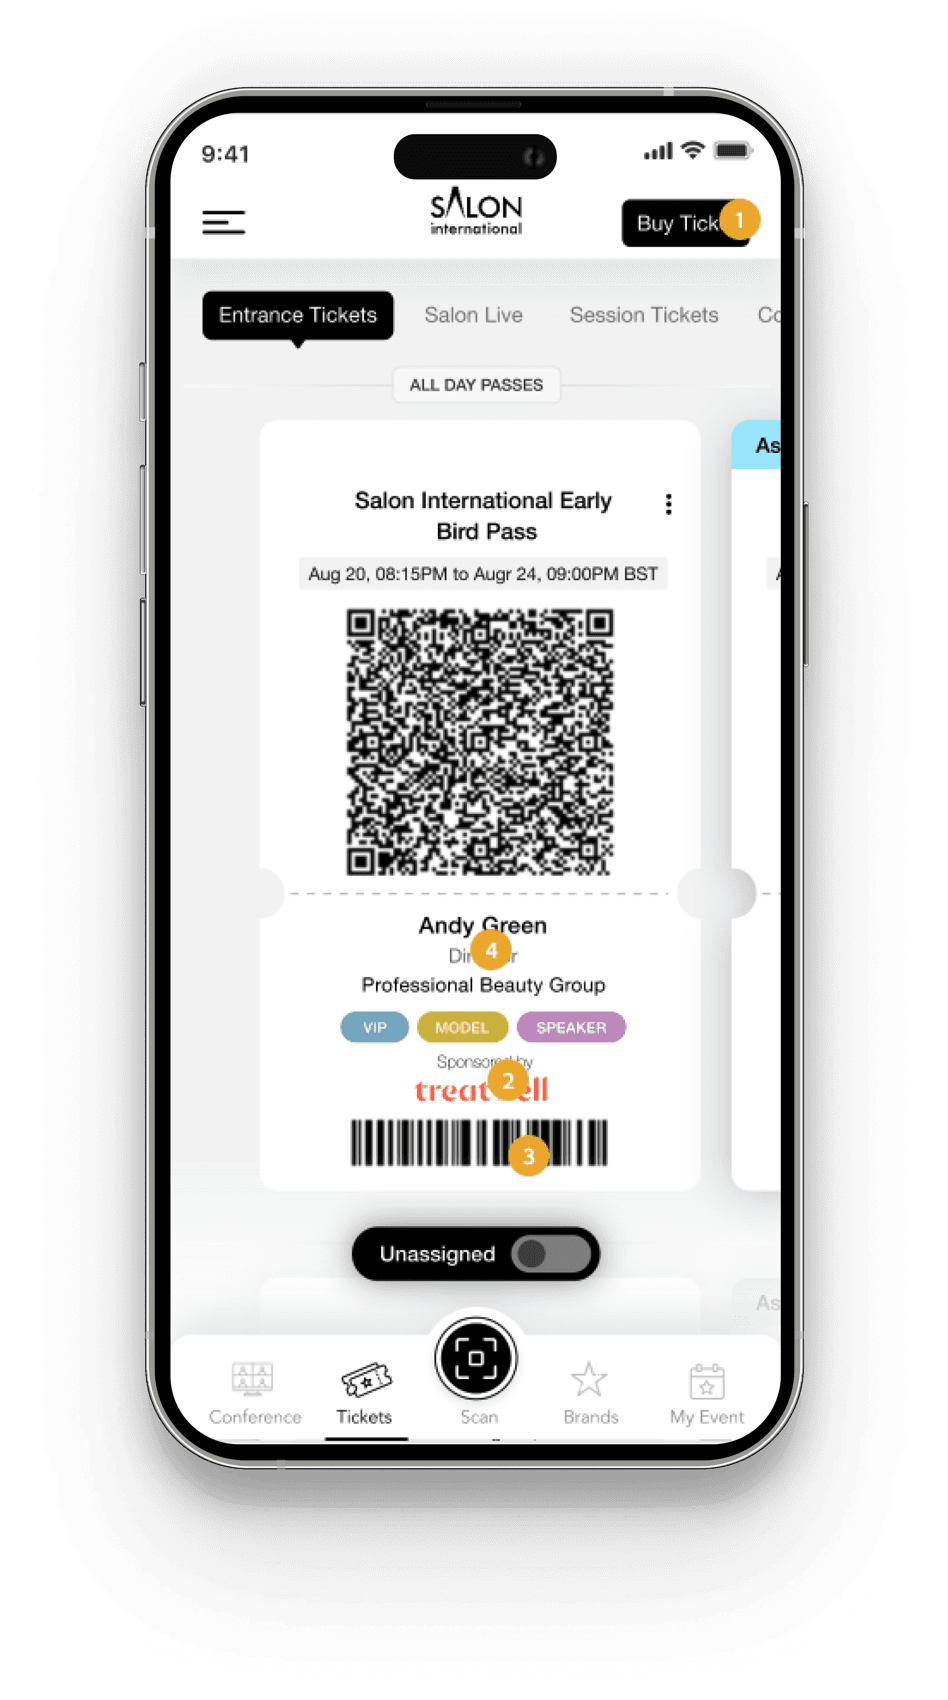
  2. Provide enhanced navigation options to simplify the process of finding ticket information.
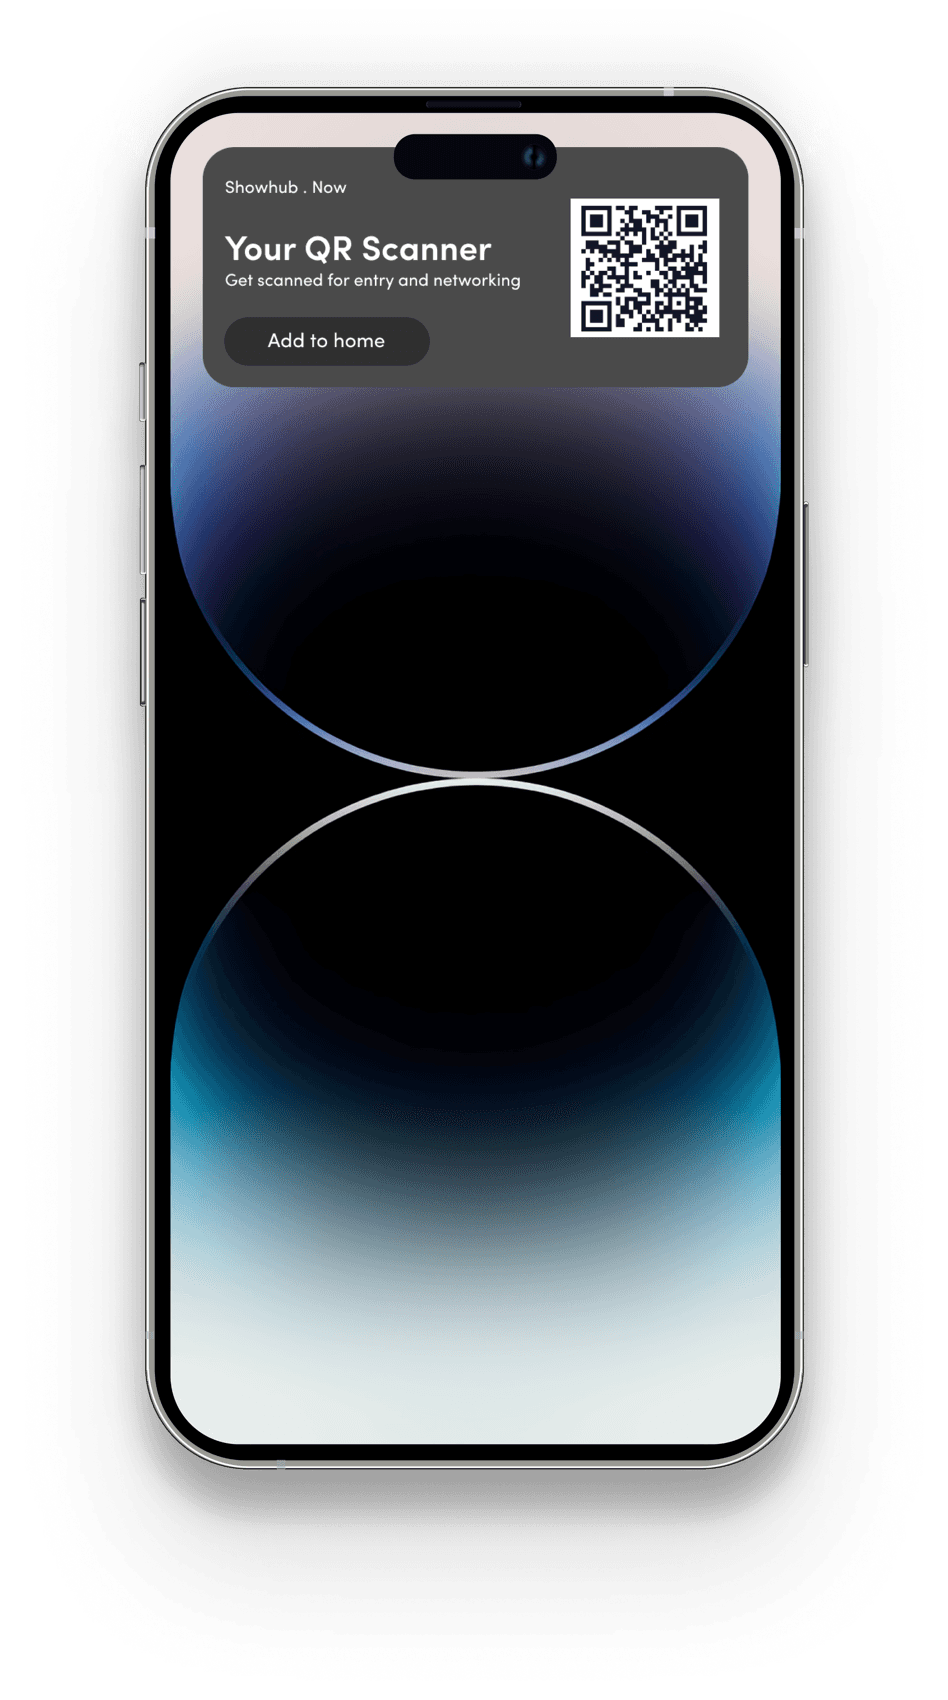
  3. Enable users to add a QR code directly to their home screen via a widget (available exclusively on the app).
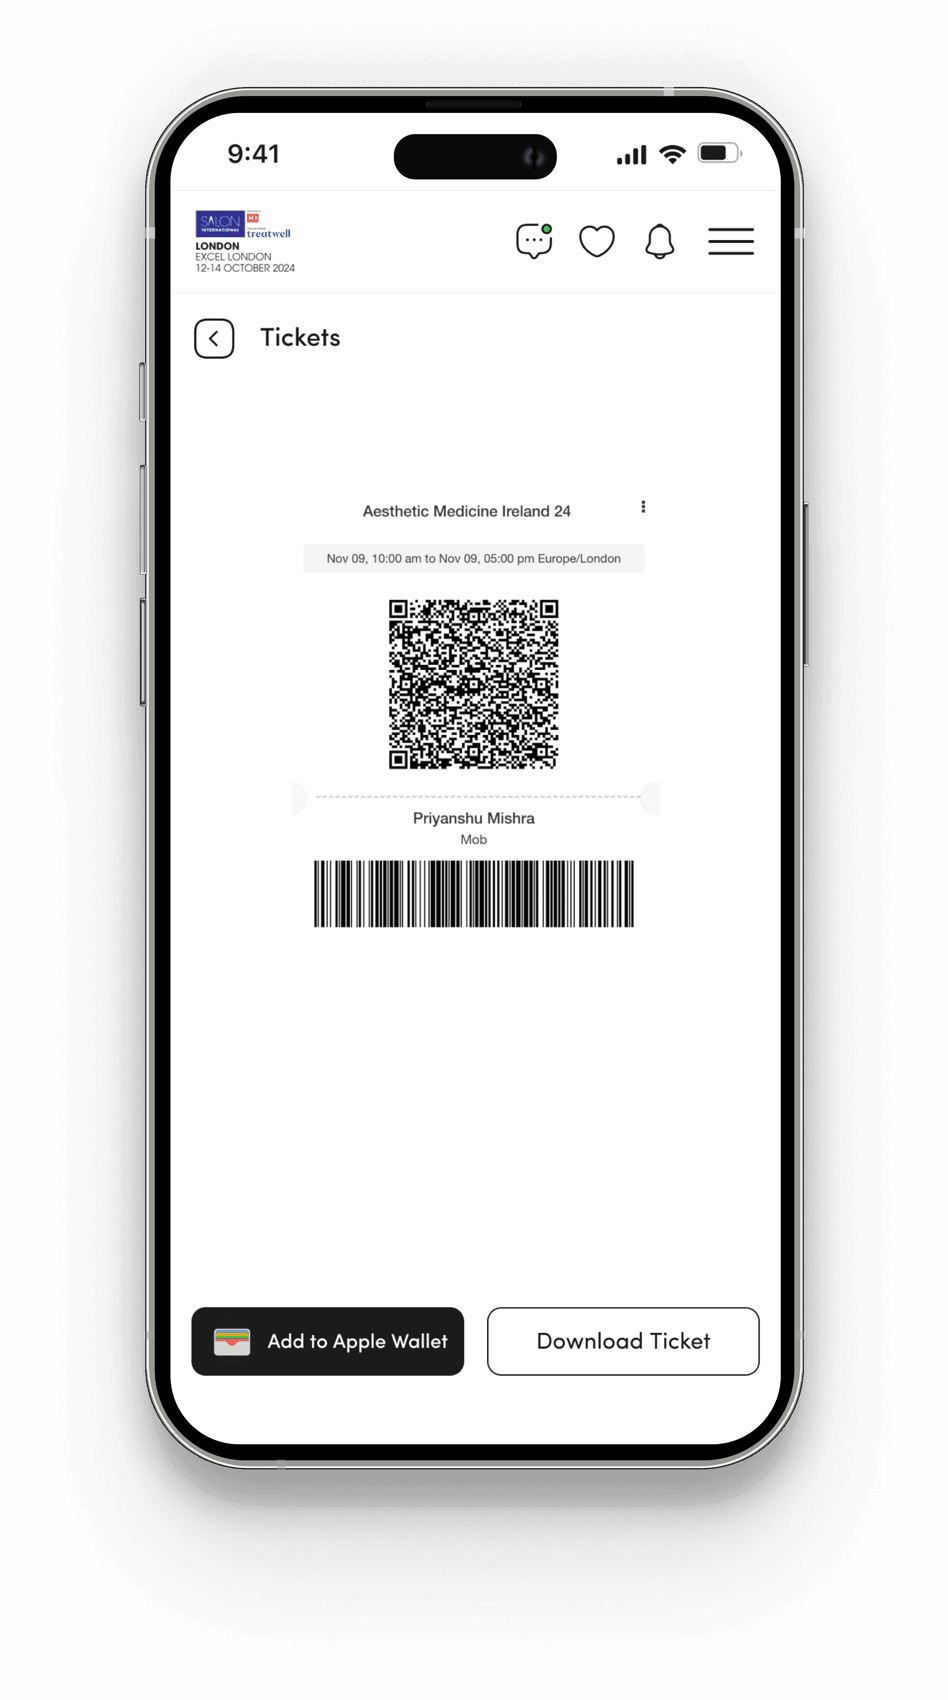
Showhub screen: Ticket access (mobile).Showhub screen: Ticket access (mobile).Showhub screen: Ticket access (mobile).
  • Pain causing - High
  • Effort to fix - Low
  • User type - Visitor
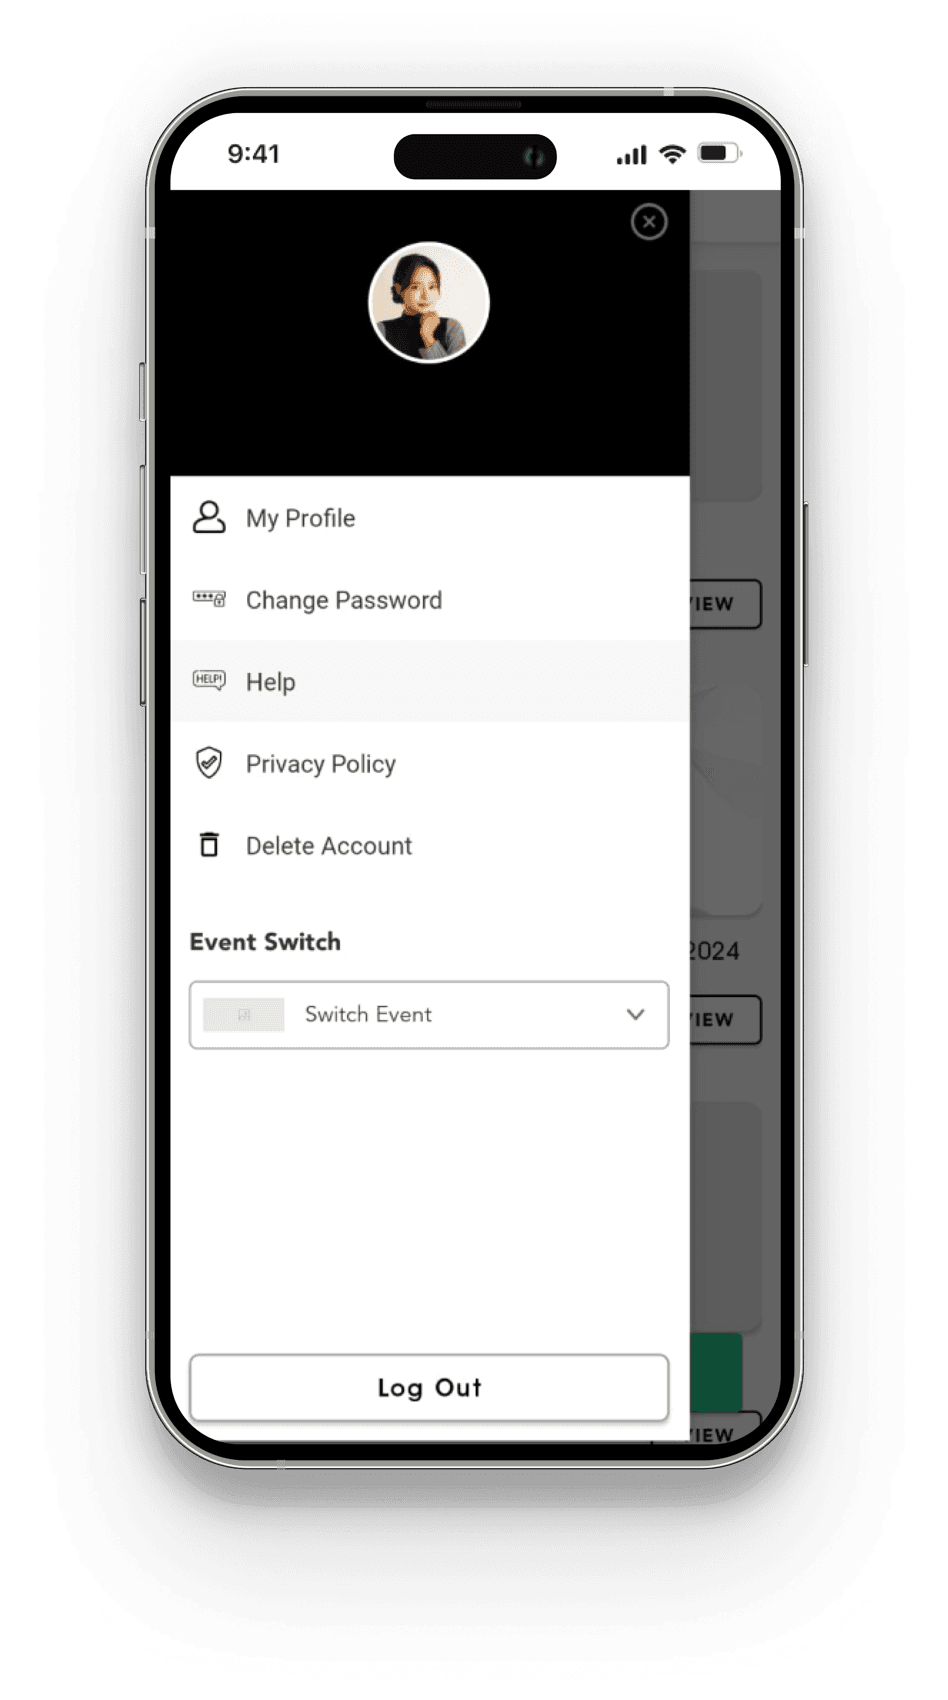
2Enhancing Event Access Clarity

Pain Points (Tickets)

Users are often unclear about the distinction between tickets and badges. The lack of clarity around these terms and their specific purposes makes it difficult for users to determine which is required for particular actions or events.

Repercussions (Tickets)

Users may create their own workarounds, potentially using tickets or badges incorrectly, which could lead to complications during event access or interactions. This could result in wasted time and missed opportunities.

Solution (Tickets)

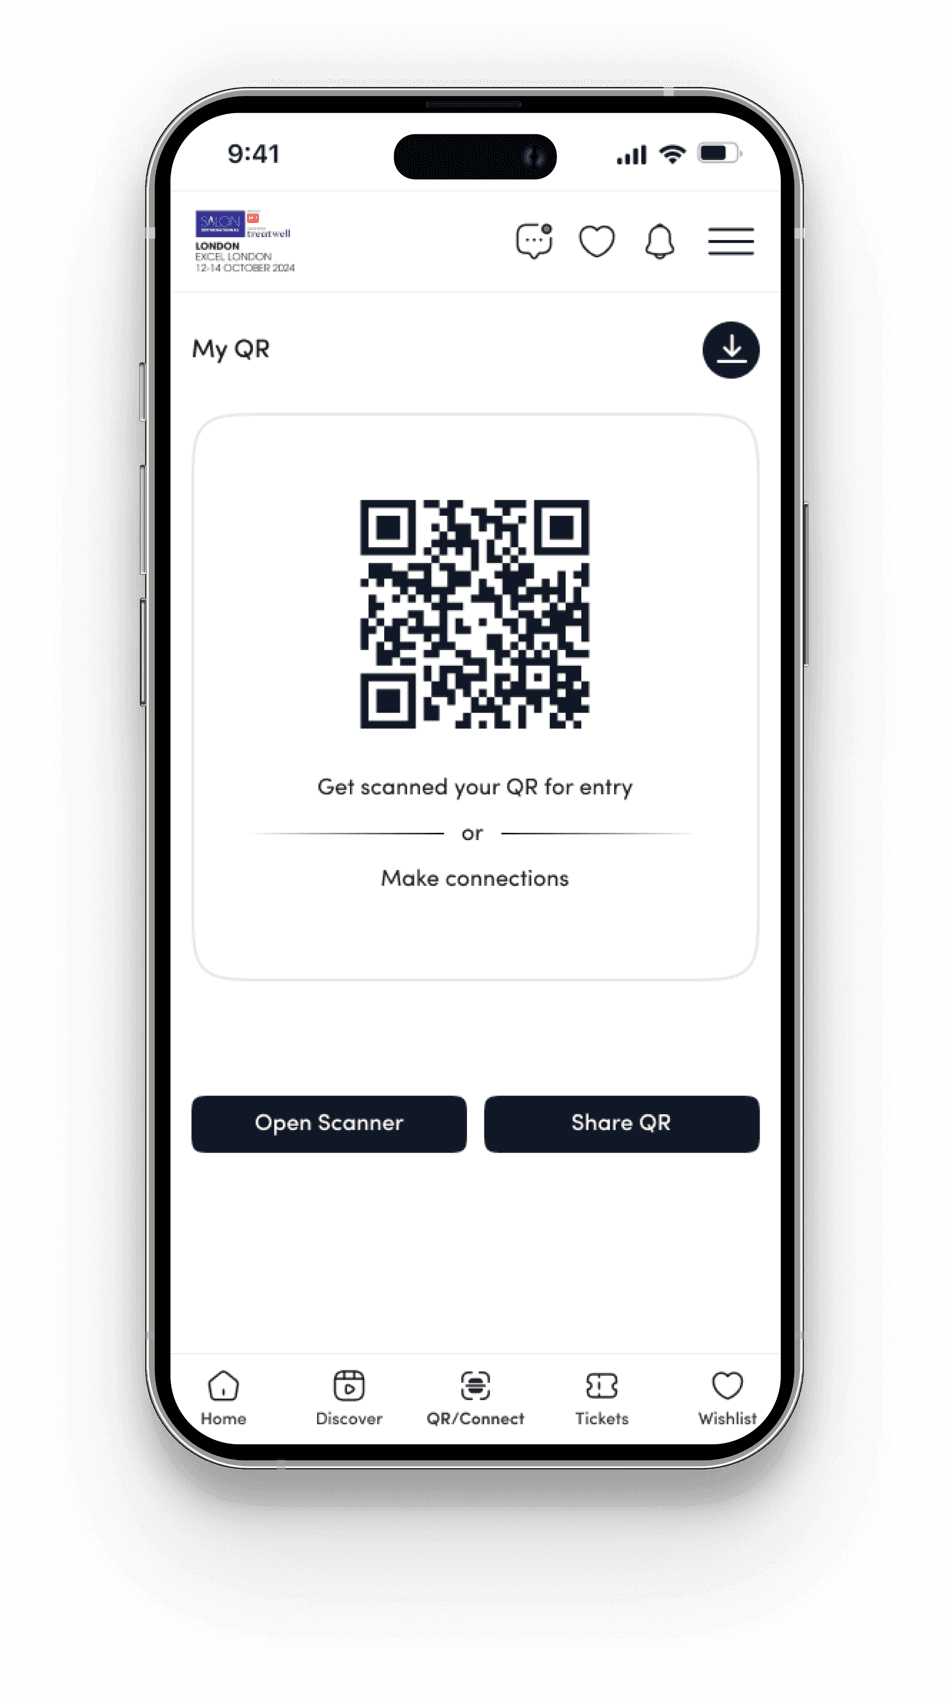
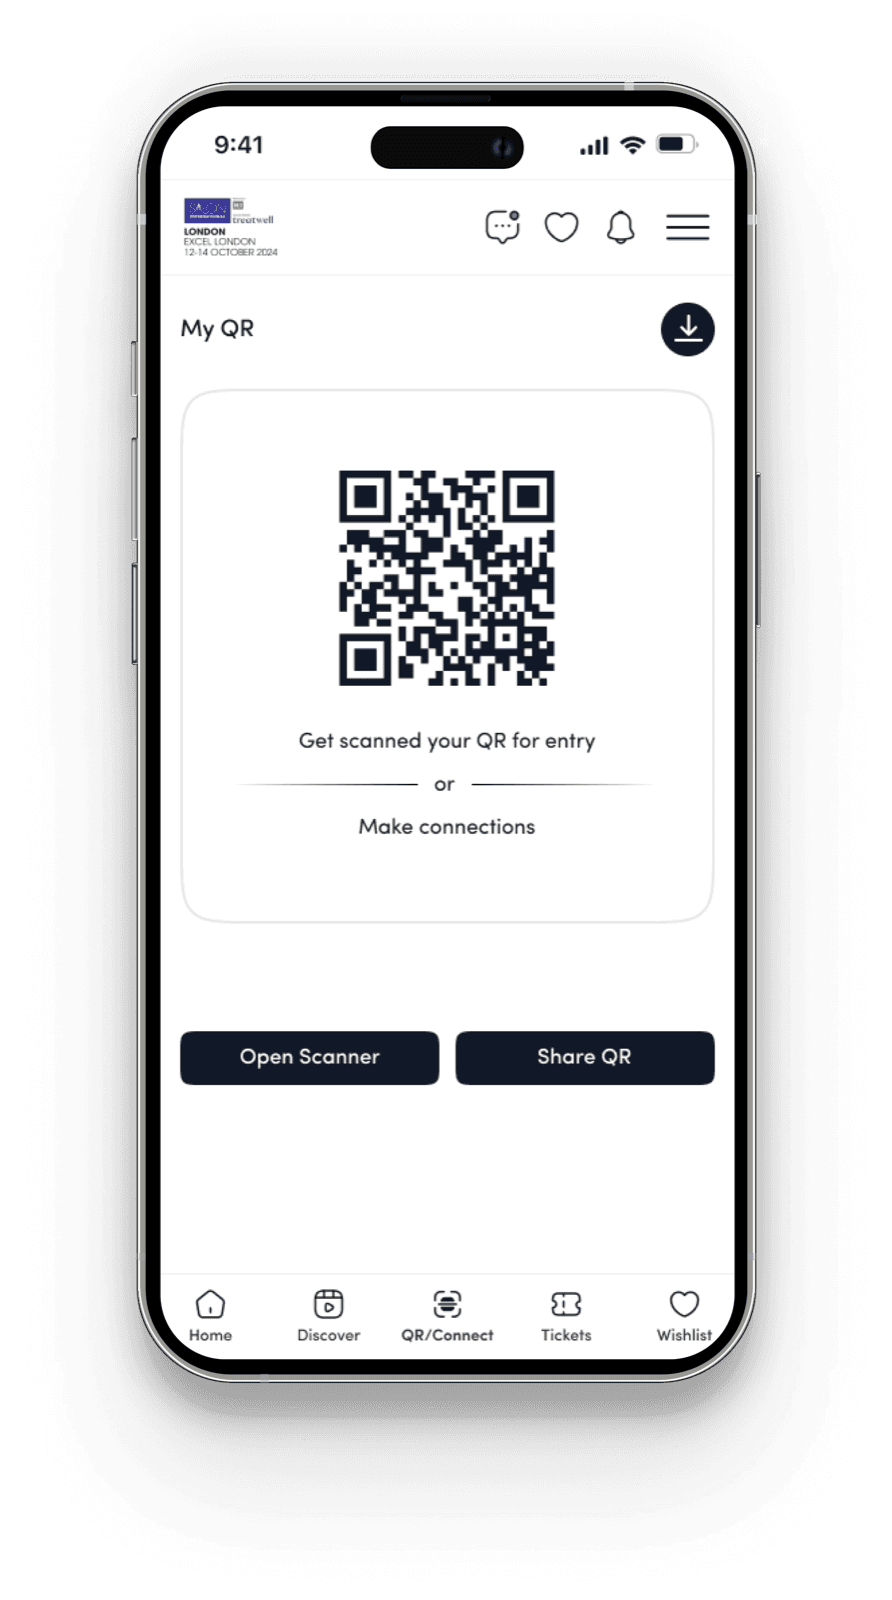
  1. Launch a new "My QR" section that serves as a personalized badge, containing the user’s details and enabling seamless connections during events and can be used to make entry(will also act as tickets which holds the data of all the tickets booked on that ID).
Old Screen
Showhub screen: Event access, old (mobile).
New Screen
Showhub screen: Event access, new (mobile).Showhub screen: Event access, new (mobile).

Note : We introduced a new “My QR” section in the main menu. It lets users view tickets, enter events easily, and use the same QR for networking. This unifies ticket access, entry, and connections in one place.

Users can scan or share their QR code to connect.

  • Pain causing - High
  • Effort to fix - Low
  • User type - Both

3Portal Inactive: Enhancing User Clarity and Access During Event Transitions

Pain Points (Portal Inactive)

Users experiences confusion when redirected to an unexpected website instead of the intended one. For example, when attempting to log into a profile of year 2024 website shortly after the event ended, users were redirected to the 2025 login screen, leaving them unsure where to find their up-to-date data.

Repercussions (Portal Inactive)

This disruption creates uncertainty, leading to anxiety about accessing important information and potentially hindering their ability to stay informed.

Solution (Portal Inactive)

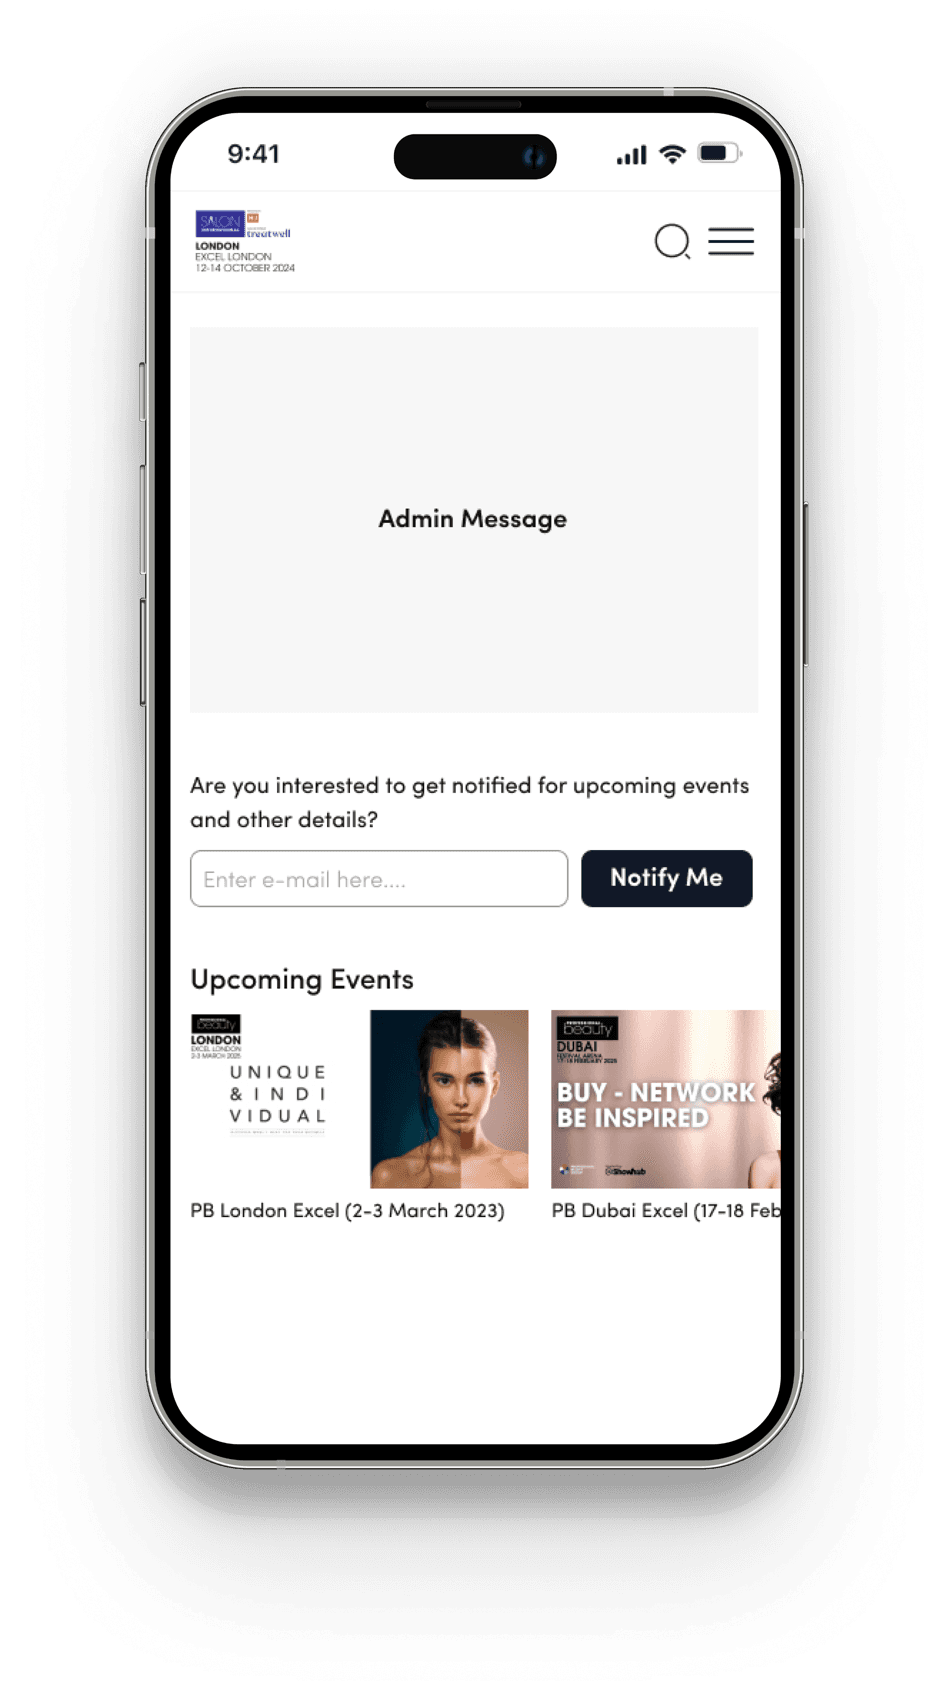
  1. When an event is disabled, users will still be able to log in and view a clearly drafted message from the admin.
  2. Users can provide their email addresses to receive notifications when the event becomes active again next year.
  3. Additionally, users will be able to view details about the current event and express interest in receiving notifications for future events.
Inactive event screen with admin message, notify-me email field and upcoming events.
  • The admin will have the ability to enable or disable the post-event message.
  • The admin will have the ability to redirect to another website or display a screen with a message.
  • Pain causing - High
  • Effort to fix - Low
  • User type - Both

4Enhancing User Engagement with Comprehensive Event Information and Seamless Ticket Booking

Pain Points (Data/Information)

Users feel that our platform lacks sufficient information, such as details about workshops, sessions, speakers, products, and conferences

Repercussions (Data/Information)

This lack of information leads to low conversion rates, as users may not feel confident enough to make a purchase or book a ticket. Additionally, users might leave the site to find more detailed information elsewhere, resulting in abandoned carts and a decline in ticket sales, which ultimately affects user satisfaction and platform engagement.

Solution (Data/Information)

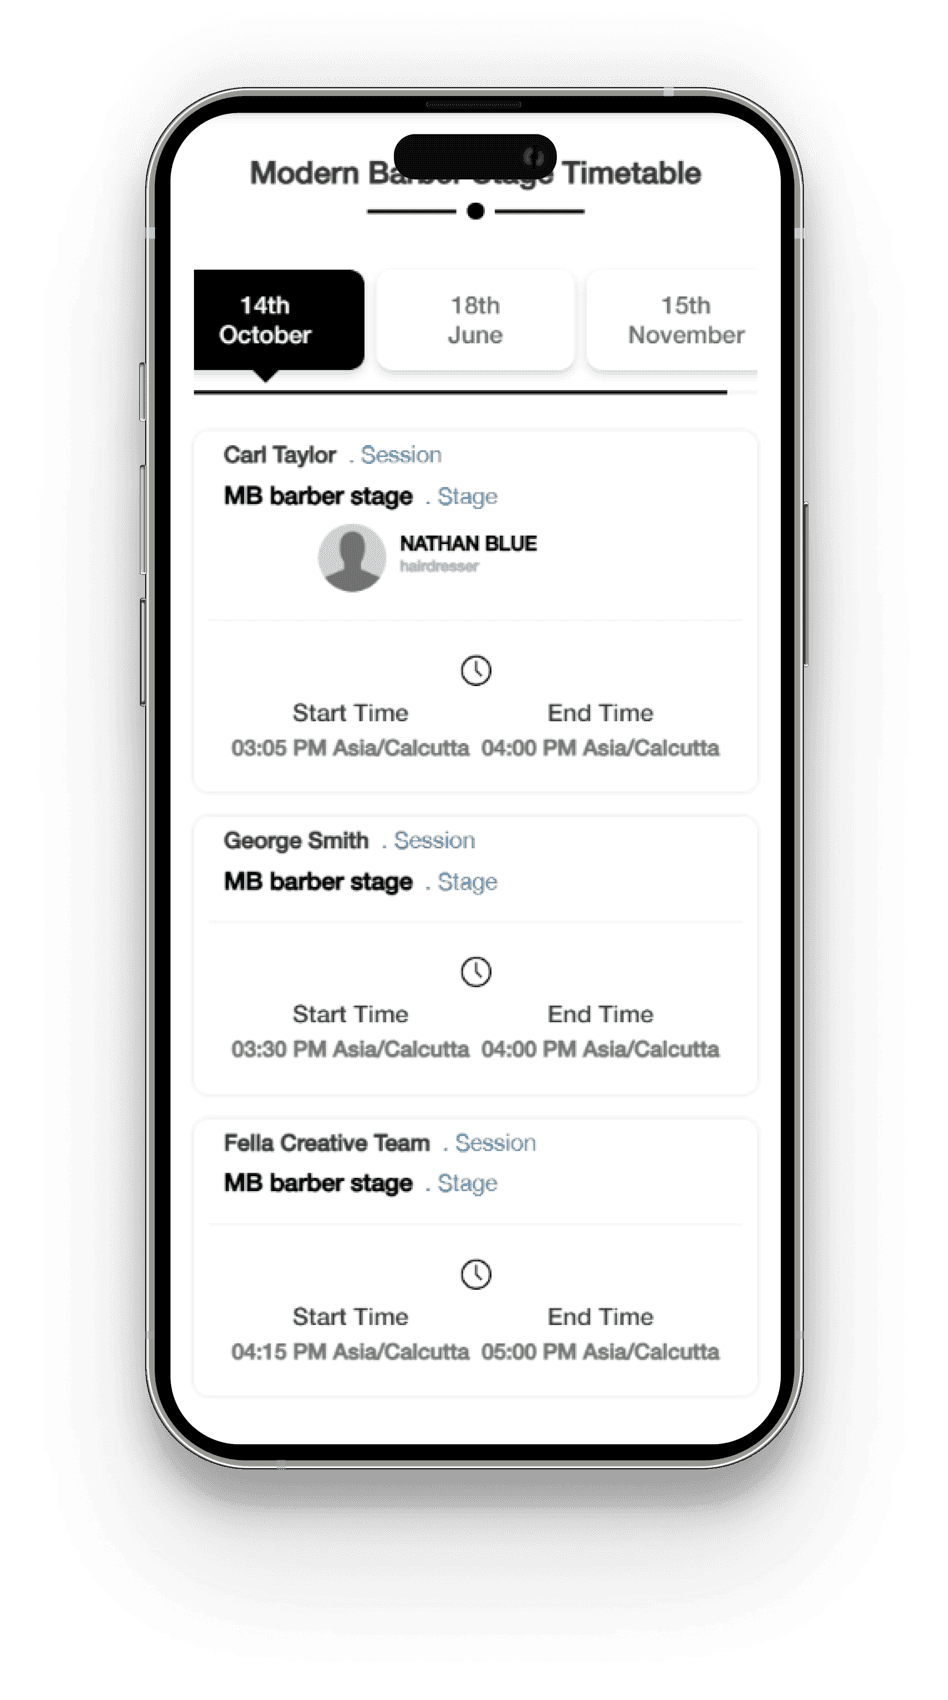
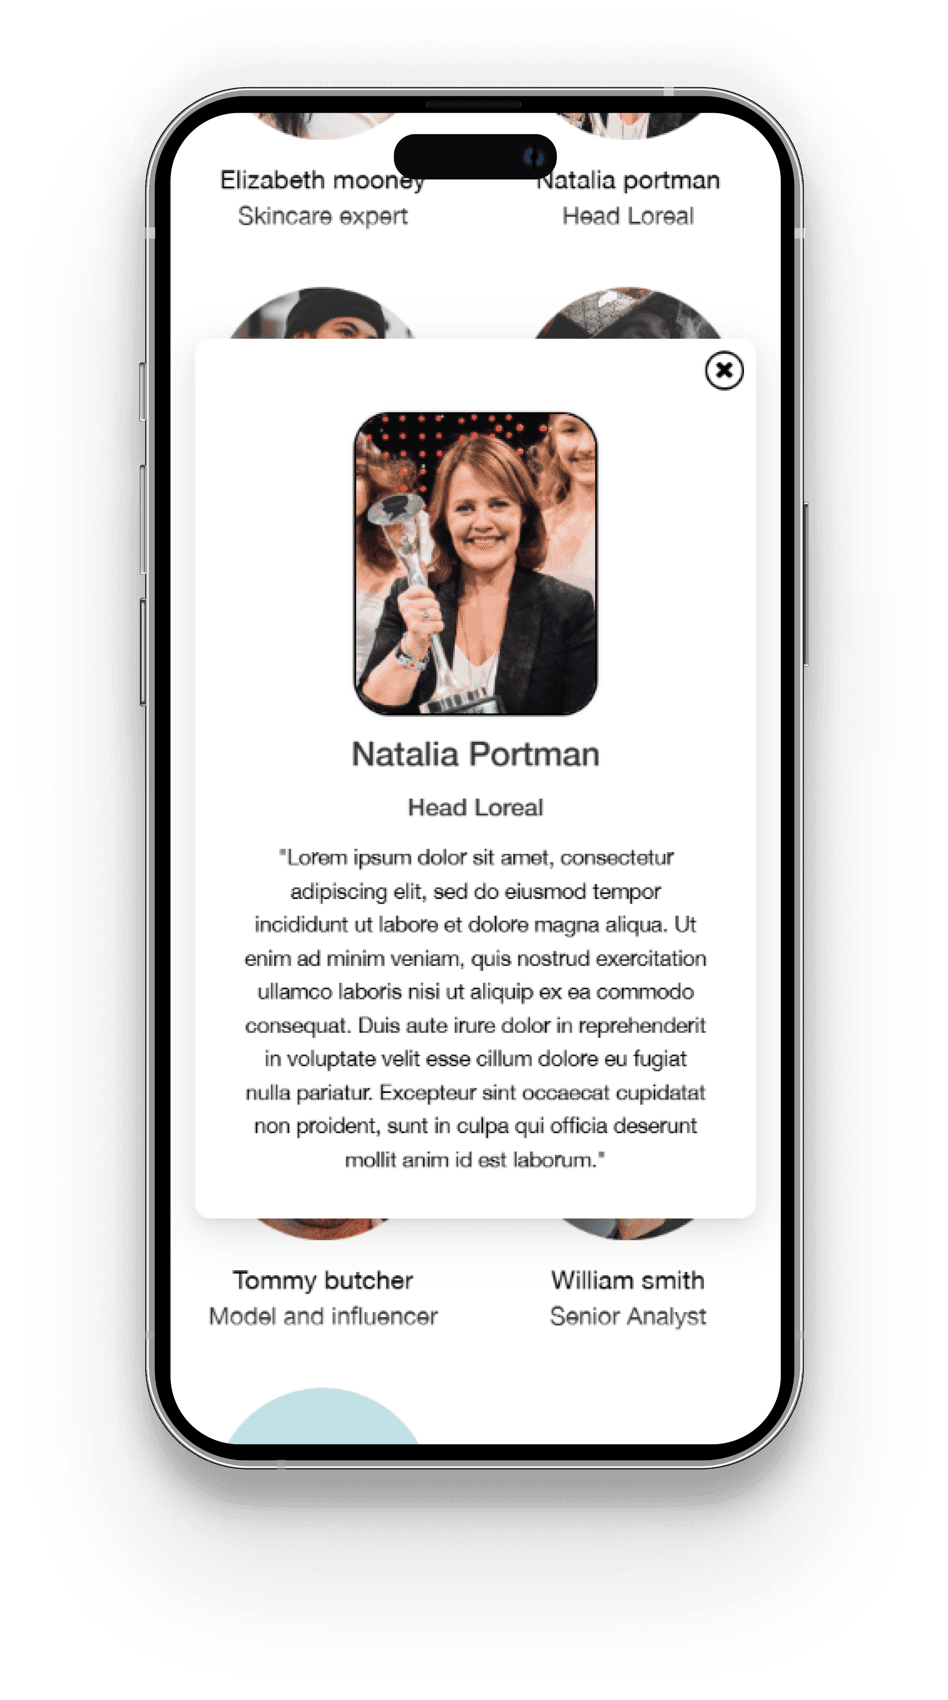
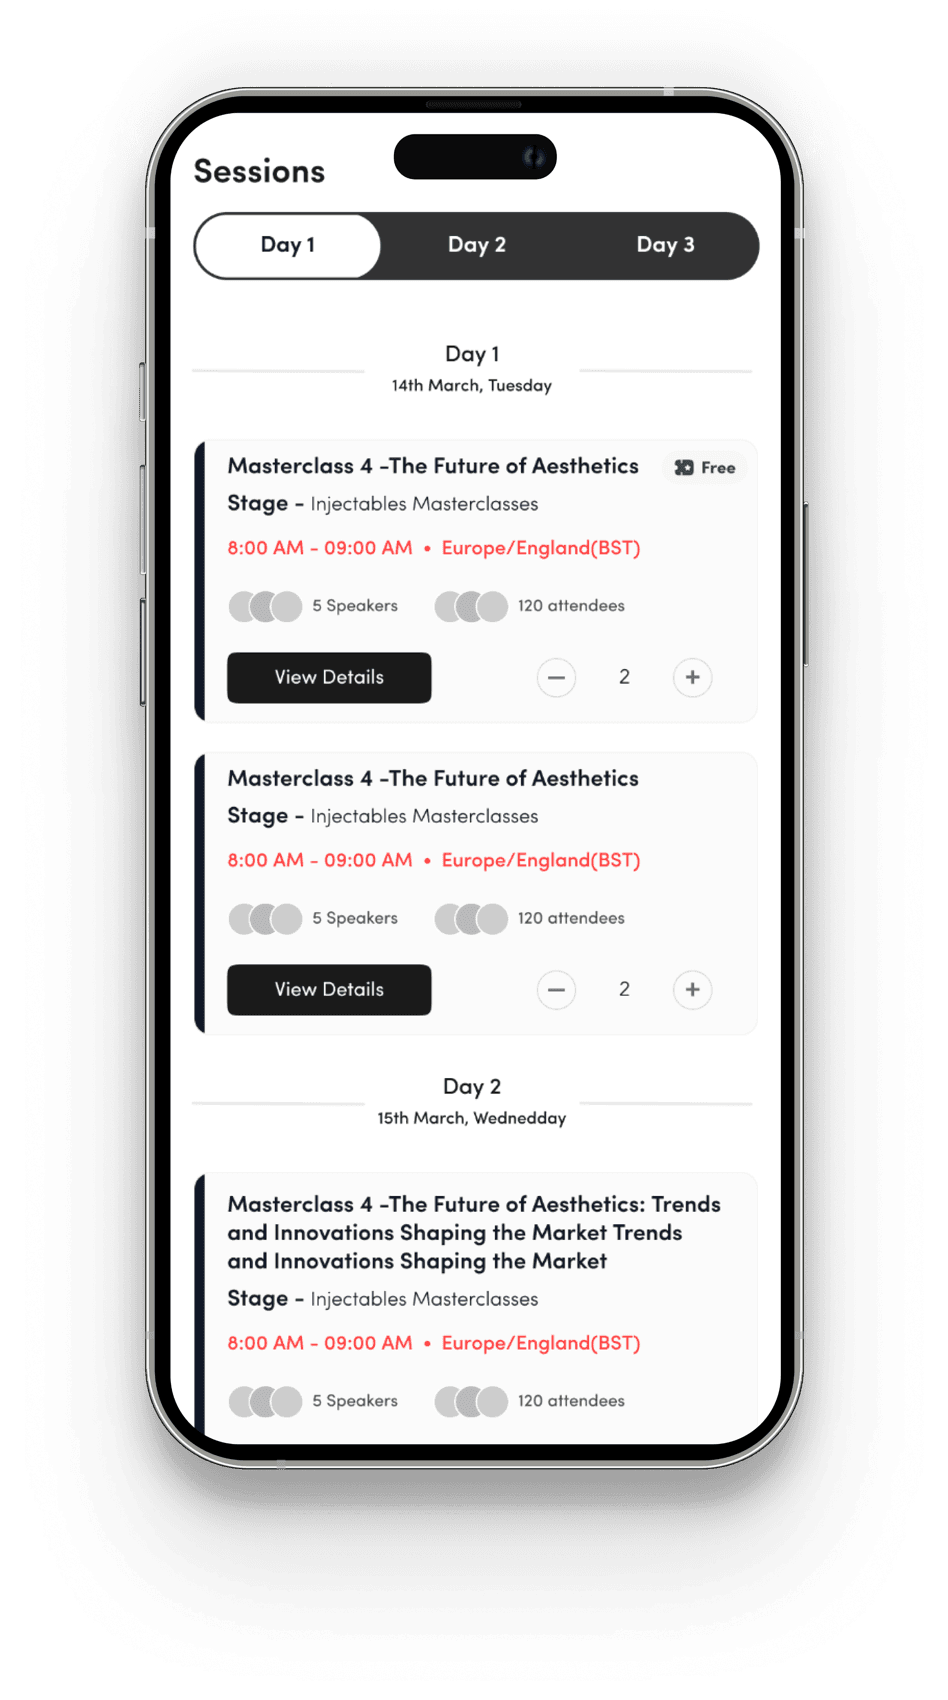
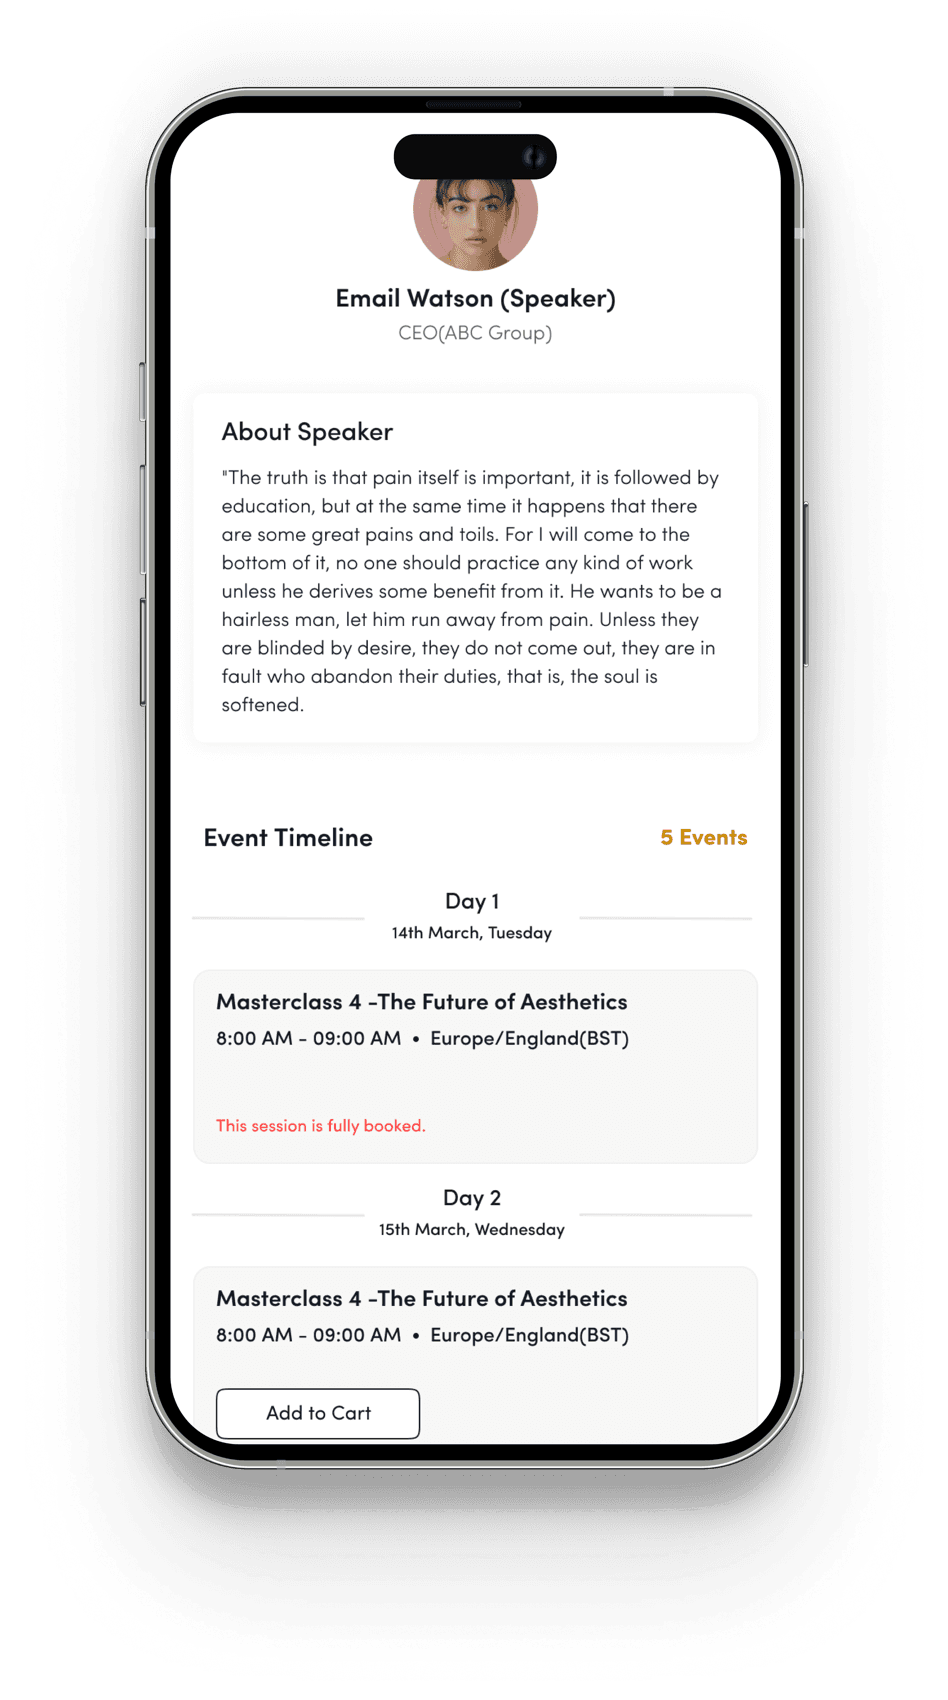
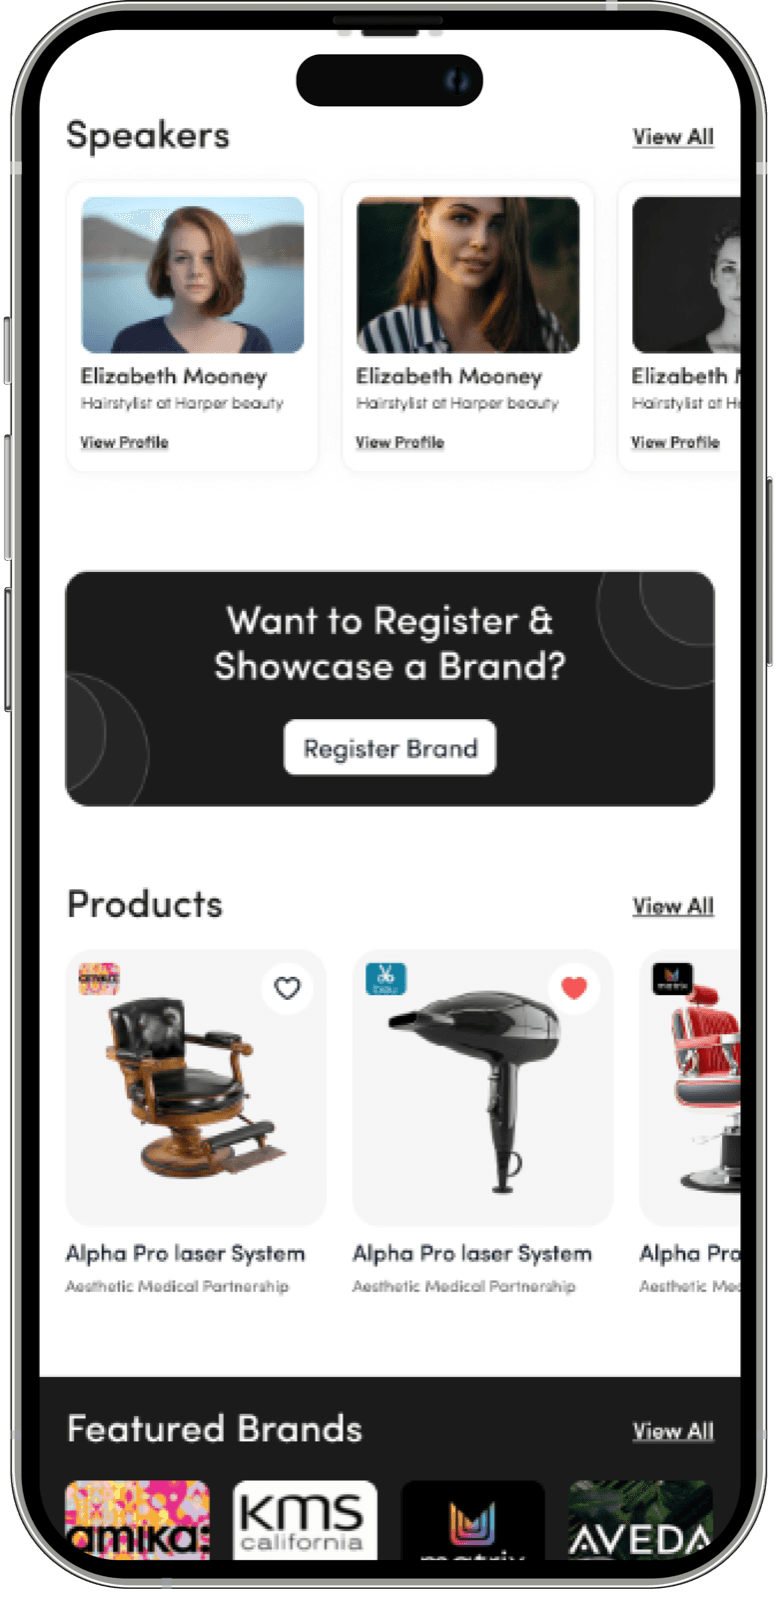
Conference pages are redesigned with clearer details, a strong ticket CTA, attendee count, and direct add-to-cart options. Users can filter sessions by day, explore a dedicated speaker page for booking, and access a new Discover section showcasing educational and promotional content from exhibitors and admins for better engagement and exploration.
Old Screen
Showhub screen: Event information, old (mobile).Showhub screen: Event information, old (mobile).
New Screen
Showhub screen: Event information, new (mobile).Showhub screen: Event information, new (mobile).
  • A new “Book Ticket” button allows quick booking, with events now organised by day for easier browsing. Users can add session tickets to their cart, see attendee counts, and view all sessions by a speaker in one place—booking directly from their profile.
  • Pain causing - High
  • Effort to fix - Medium
  • User type - Both

5Enhancing User Support: Addressing Pain Points, Reducing Delays, and Improving Satisfaction

Pain Points (Support)

Users experience a lack of adequate support when they face any issue or issues are left unresolved or take an extended time to address.

Repercussions (Support)

Unresolved issues or delays in addressing user concerns can result in users facing inefficiencies, such as being unable to complete tasks or access important features. This can lead to frustration, dissatisfaction, and feelings of being undervalued.

Solution (Support)

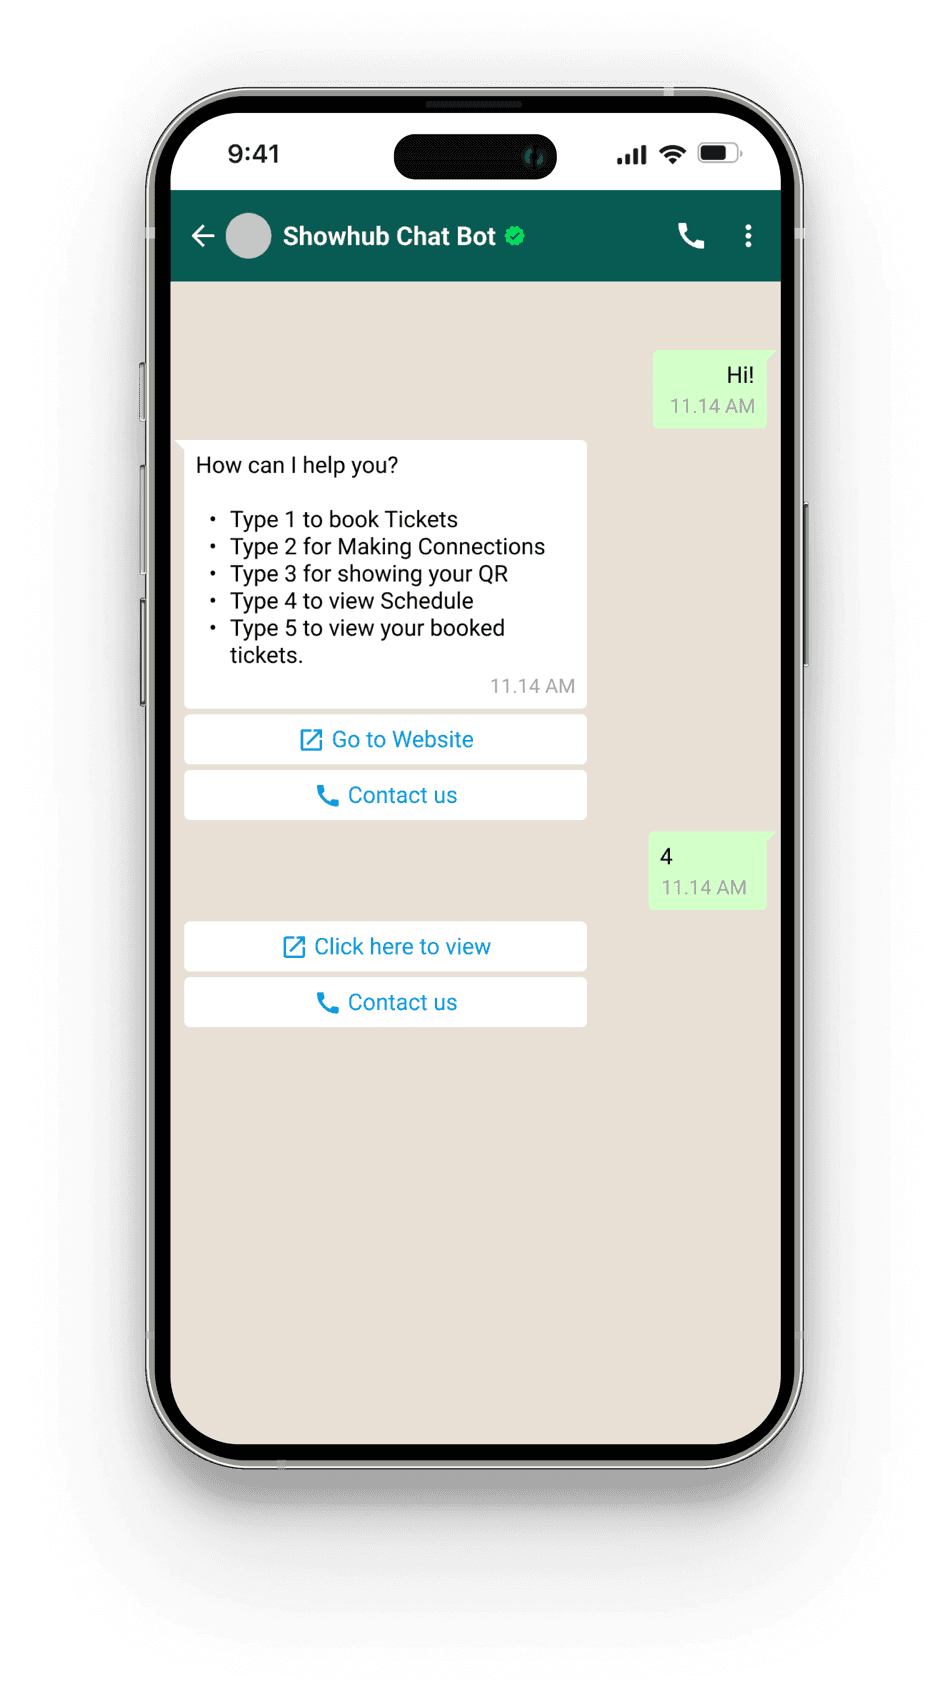
Chat bot with built in FAQ section which will help users solve their own issues, or escalate to create a ticket if unable.
Showhub screen: User support (mobile).Showhub screen: User support (mobile).
  • Pain causing - High
  • Effort to fix - High
  • User type - Both

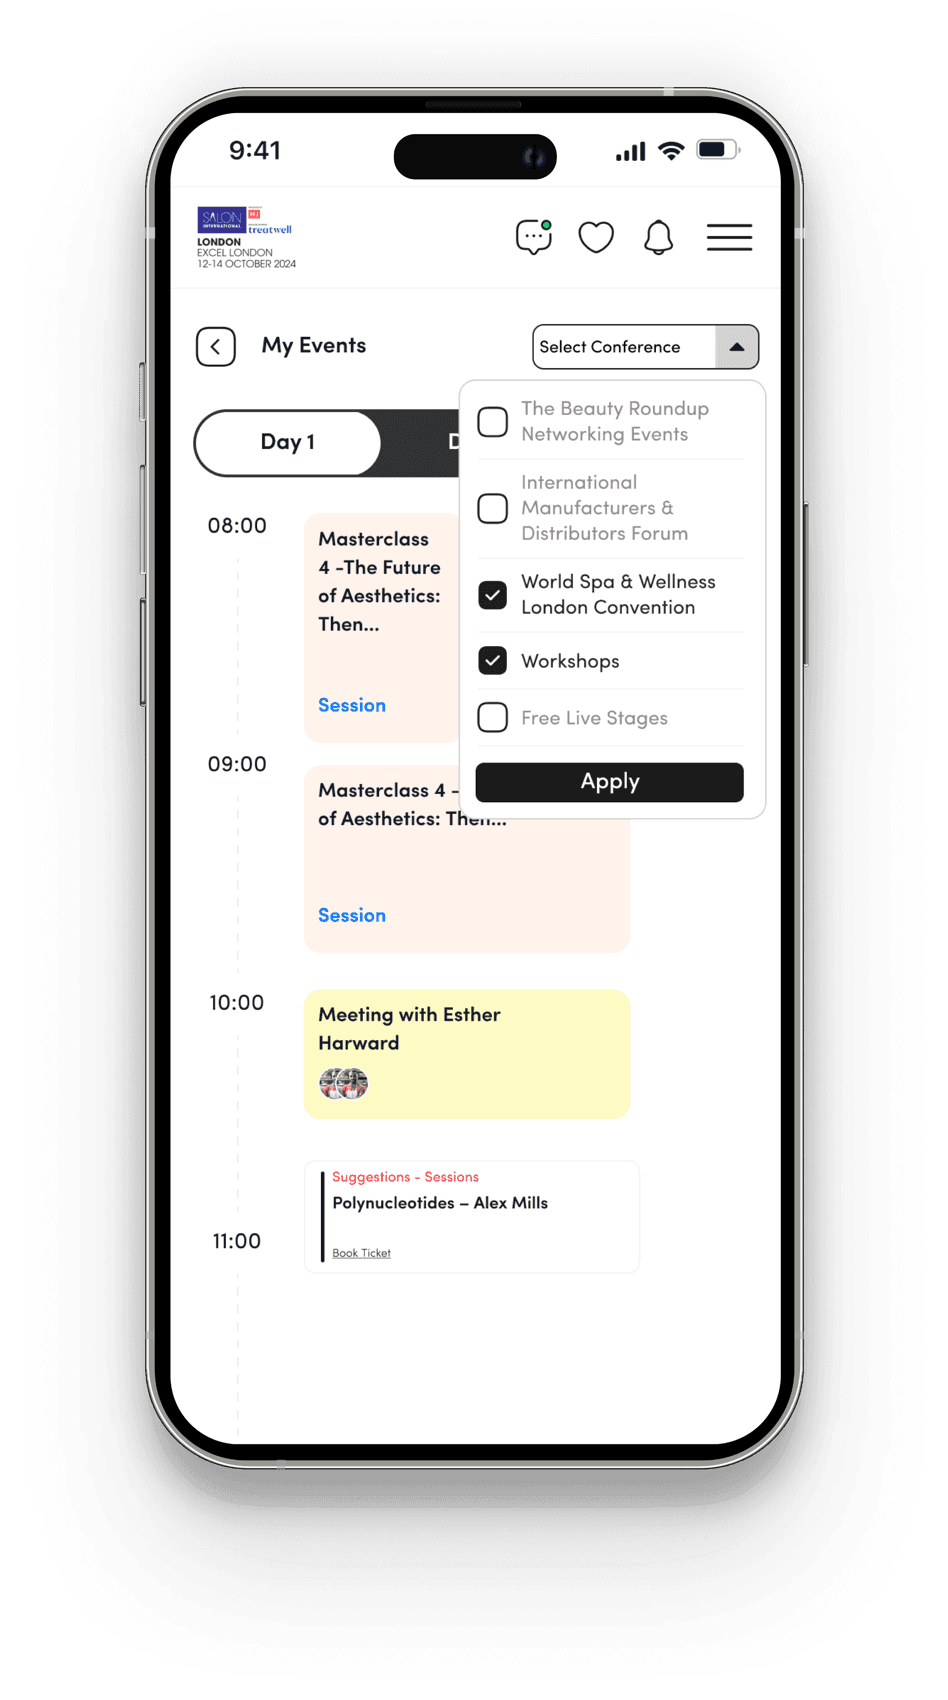
6'My Event' Section: Streamlined Access, Personalized Scheduling, and Improved User Engagement

Pain Points (My Event)

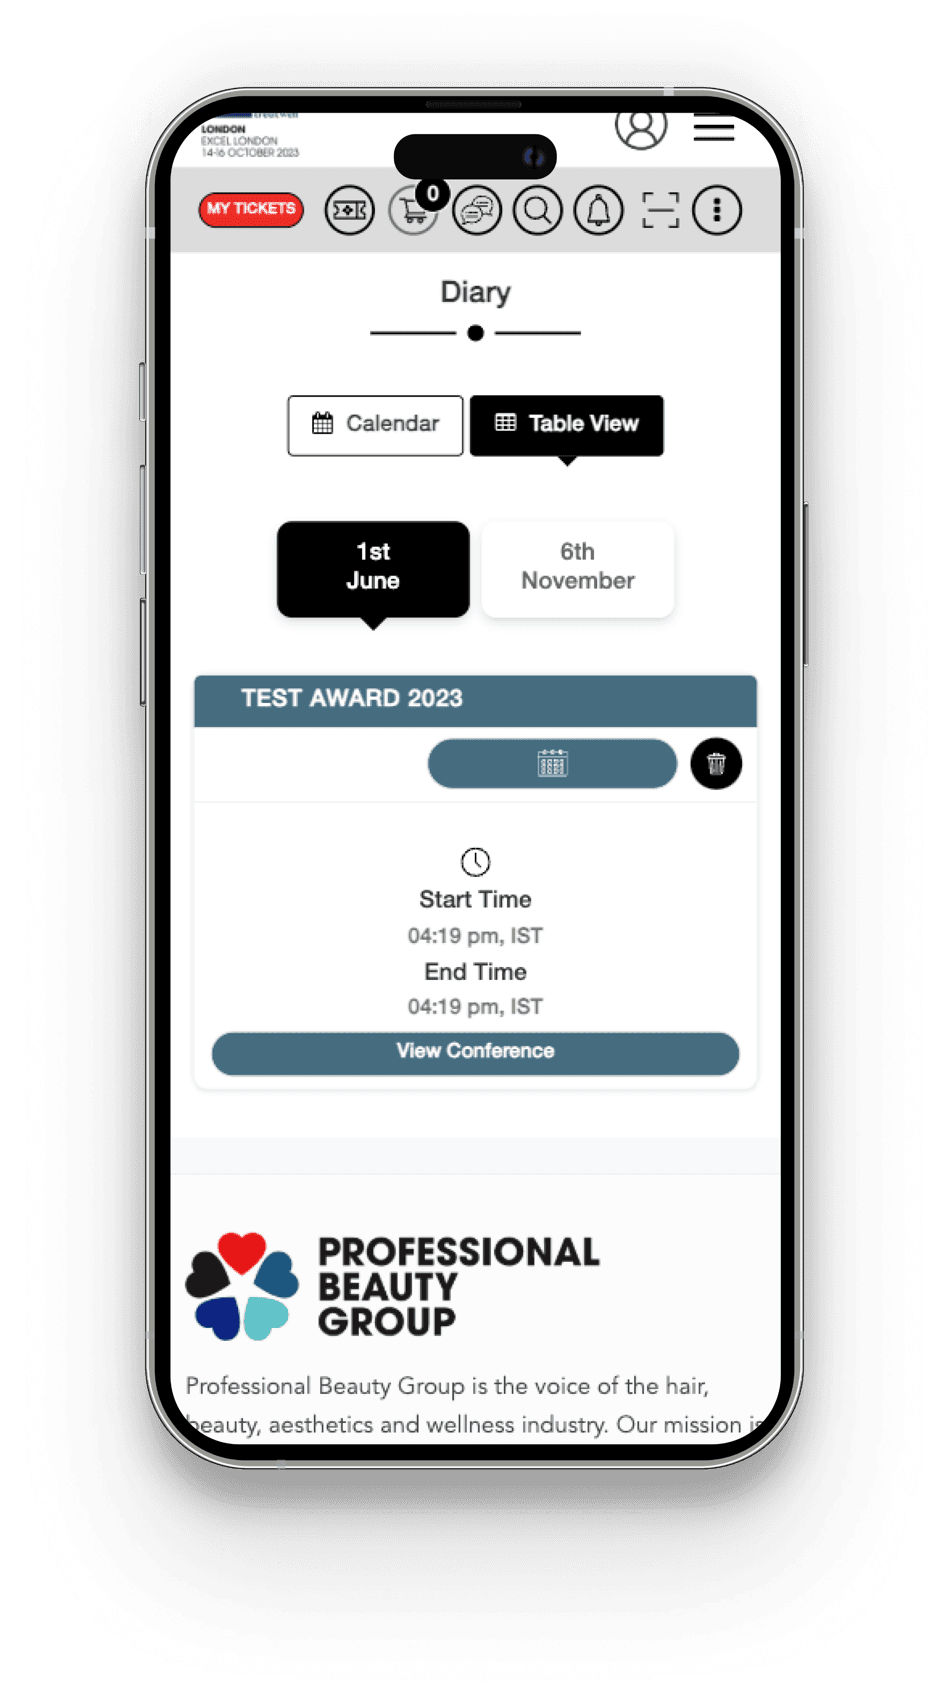
The “My Event” section is underutilized due to several design and functionality issues. It is difficult for users to locate within the app, the calendar displays an entire month rather than focusing on event-specific dates, the calendar lacks interactivity for adding or customizing schedules, and it only provides session reminders without comprehensive conference details.

Repercussions (My Event)

Users face difficulty navigating and utilizing the Event section effectively, leading to missed sessions, decreased ticket sales for events and sessions, and lower user adoption.

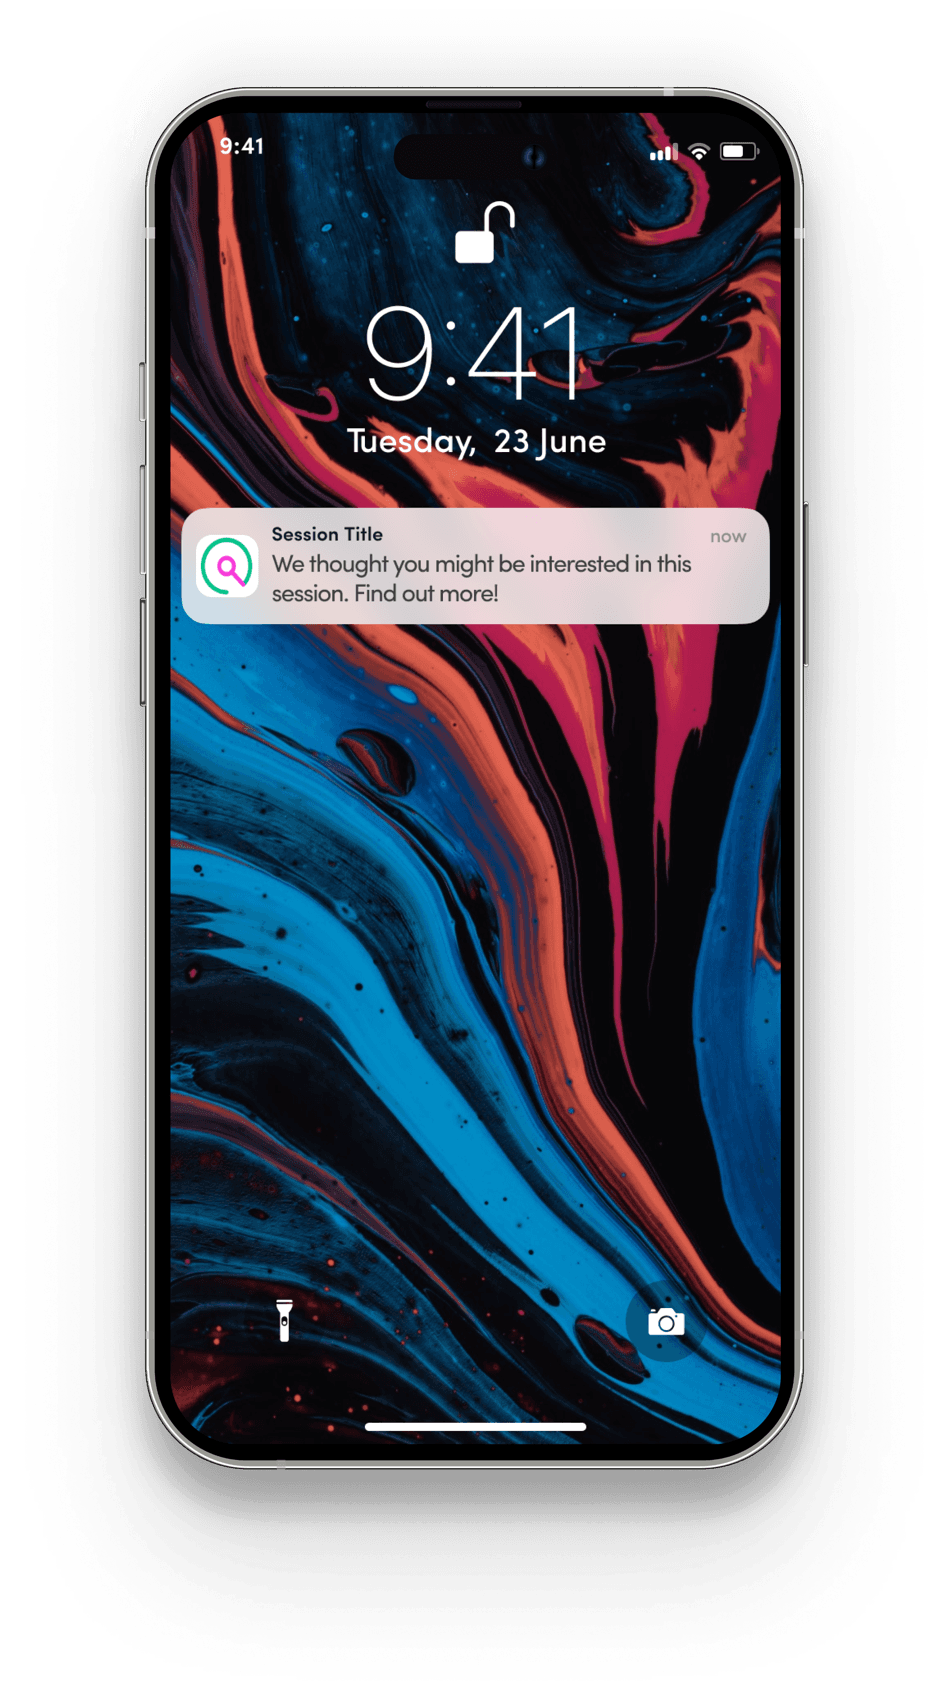
Solution (My Event)

  1. Redesign the Event section for better visibility and easy access.
  2. Update the calendar to show day-wise event sessions and meeting details.
  3. Add multi-select filters to view all conference sessions on one screen.
  4. Provide personalized recommendations based on a user questionnaire.
  5. Send push notifications for suggested content and upcoming sessions.
Old Screen
Showhub screen: My Event, old (mobile).
New Screen
Showhub screen: My Event, new (mobile).Showhub screen: My Event, new (mobile).
  • Pain causing - Medium
  • Effort to fix - Low
  • User type - Both

7Event Navigation: Interactive Floor Map and Search Functionality for Improved User Experience

Pain Points (Floor Map)

Users face challenges navigating the onsite event and locating key areas, making it difficult to find their way around efficiently.

Repercussions (Floor Map)

Difficulty navigating the event leads to frustration and wasted time for users, diminishing their overall experience. This could result in decreased engagement and satisfaction, potentially impacting their participation in future events.

Solution (Floor Map)

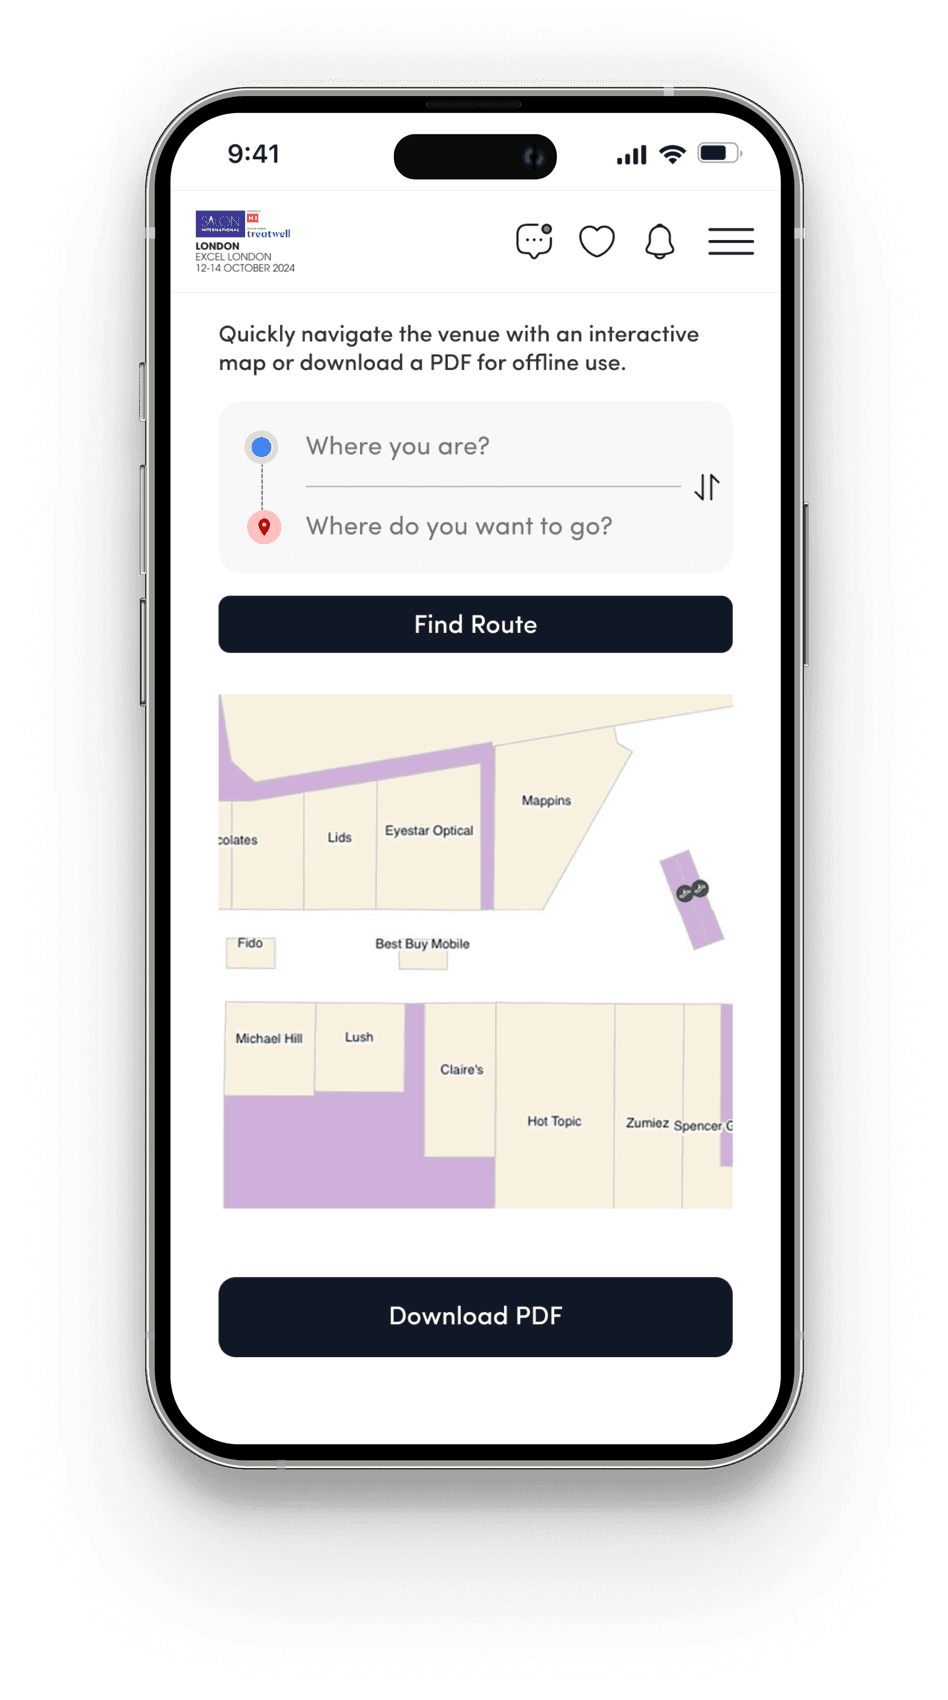
  1. Allow users to download a digital PDF copy of the floor map directly from the platform, with the map uploaded by the admin.
  2. Introducing a search functionality enabling users to locate their current position and desired destination for effective navigation.
  3. Provide easy access to navigation features directly from the app menu for a seamless user experience.
Navigation To View Floor Map
Showhub screen: Navigation to the floor map (mobile).
Floor Map View
Showhub screen: Floor map view (mobile).
  • Pain causing - Medium
  • Effort to fix - Low
  • User type - Both

8Enhancing User Engagement with an Integrated, Intuitive Global Search for Showhub

Pain Points (Search)

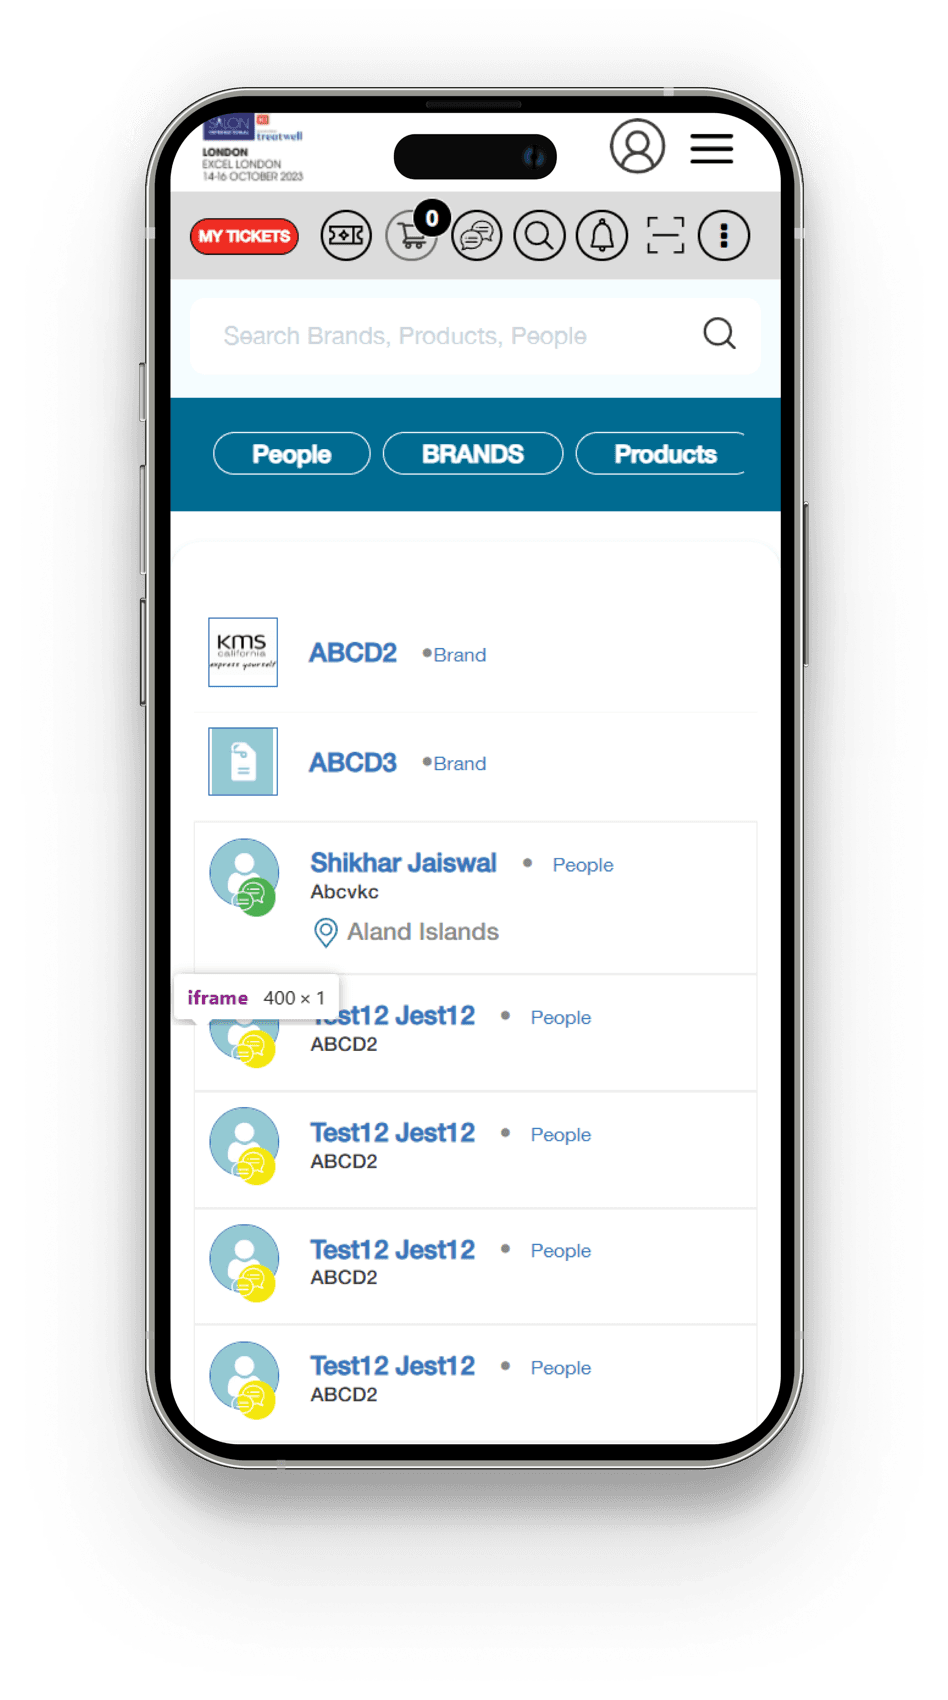
Users have difficulty finding desired products, brands, offers, sessions, and other relevant content on the platform.

Global search not currently in app (it is in web).

Repercussions (Search)

This difficulty in finding specific content results in user frustration, which can decrease engagement.

Solution (Search)

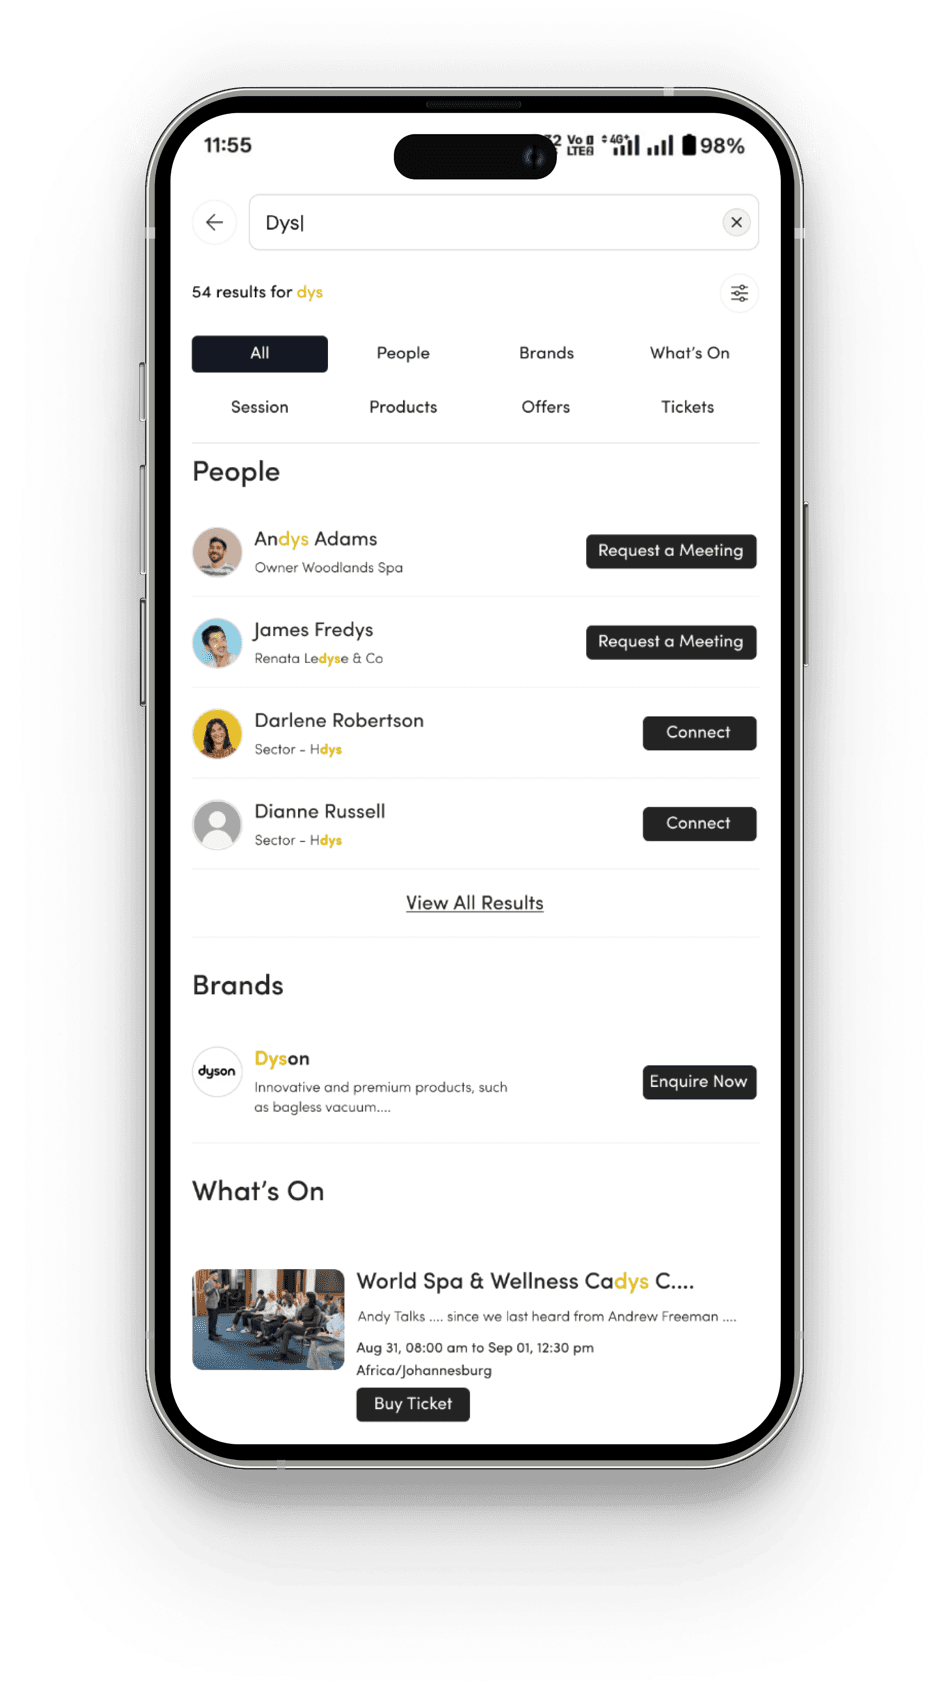
  1. Integrate a global search functionality within the app to better cater to the large user base (42% usage).
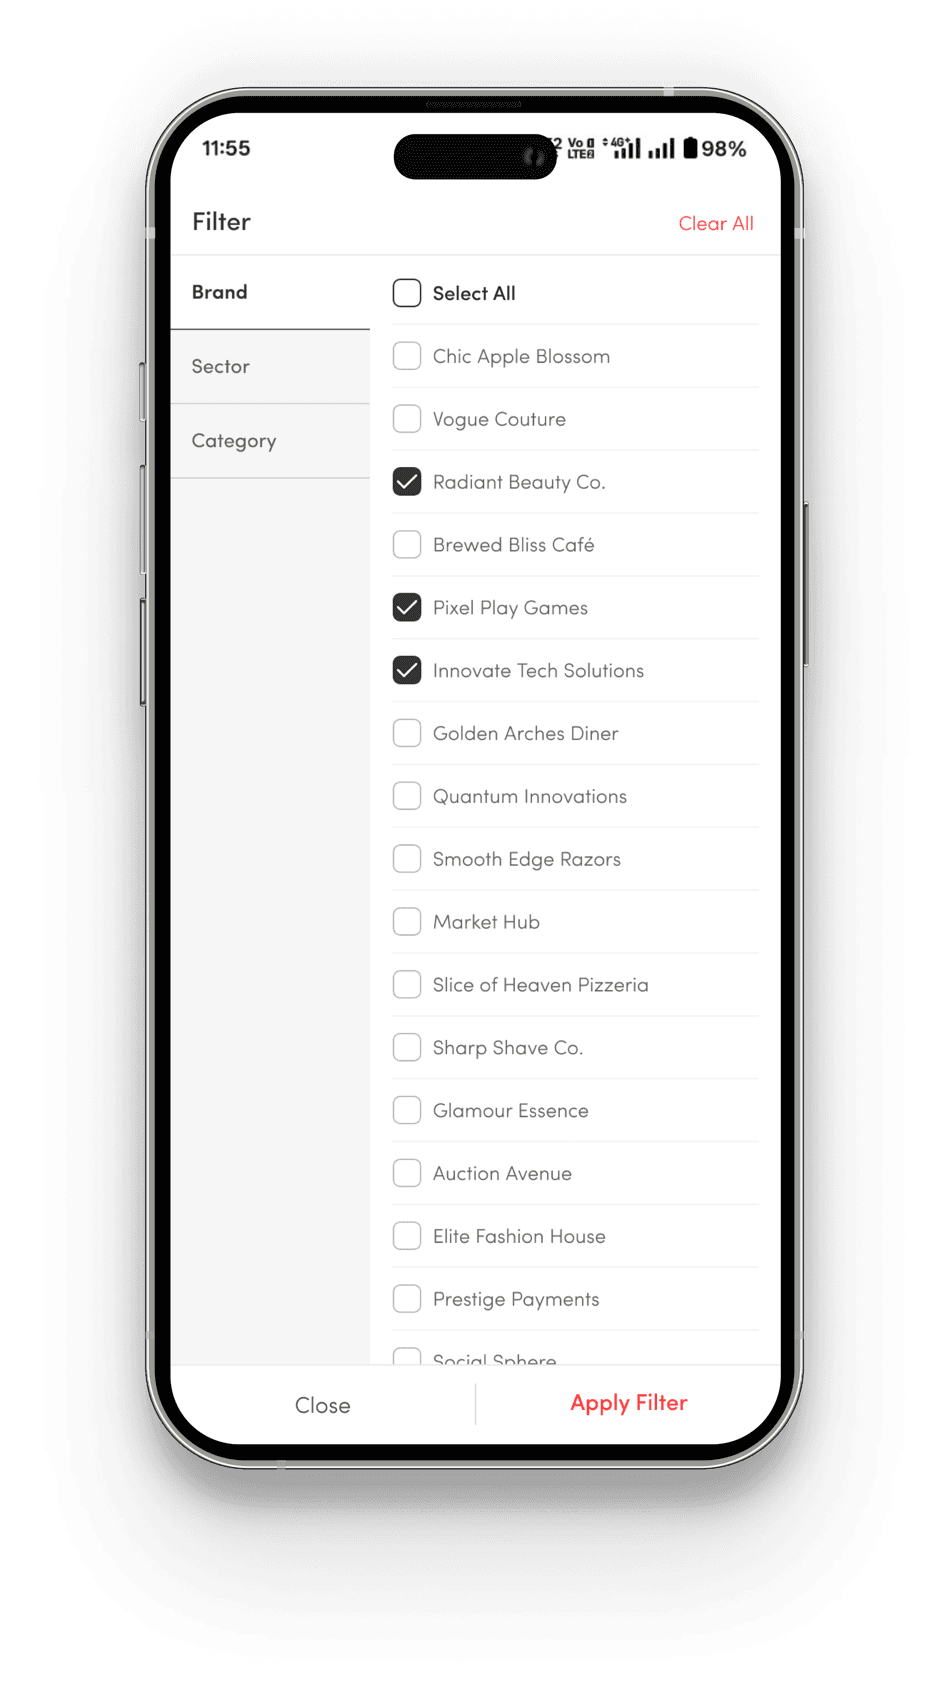
  2. Redesign the search interface to allow users to filter results by categories such as people, products, brands, conferences, sessions, etc., enhancing the search experience.
  3. Implement a more intuitive, user-friendly UI for the search screen to improve overall usability.
Old Screen
Showhub screen: Search, old (mobile).
New Screen
Showhub screen: Search, new (mobile).Showhub screen: Search, new (mobile).
  • Pain causing - Low
  • Effort to fix - Medium
  • User type - Both

9Enhancing Feature Awareness: Improving Navigation and Visibility for a Better User Experience

Pain Points (Feature Awareness)

Our survey revealed that many users are unaware of key features on our platform, such as chat, connection building, and meeting requests.

Repercussions (Feature Awareness)

Users may feel frustrated or disappointed upon discovering these features later, sometimes leading to regret for not using them sooner, which impacts their overall experience and engagement with the platform.

Solution (Feature Awareness)

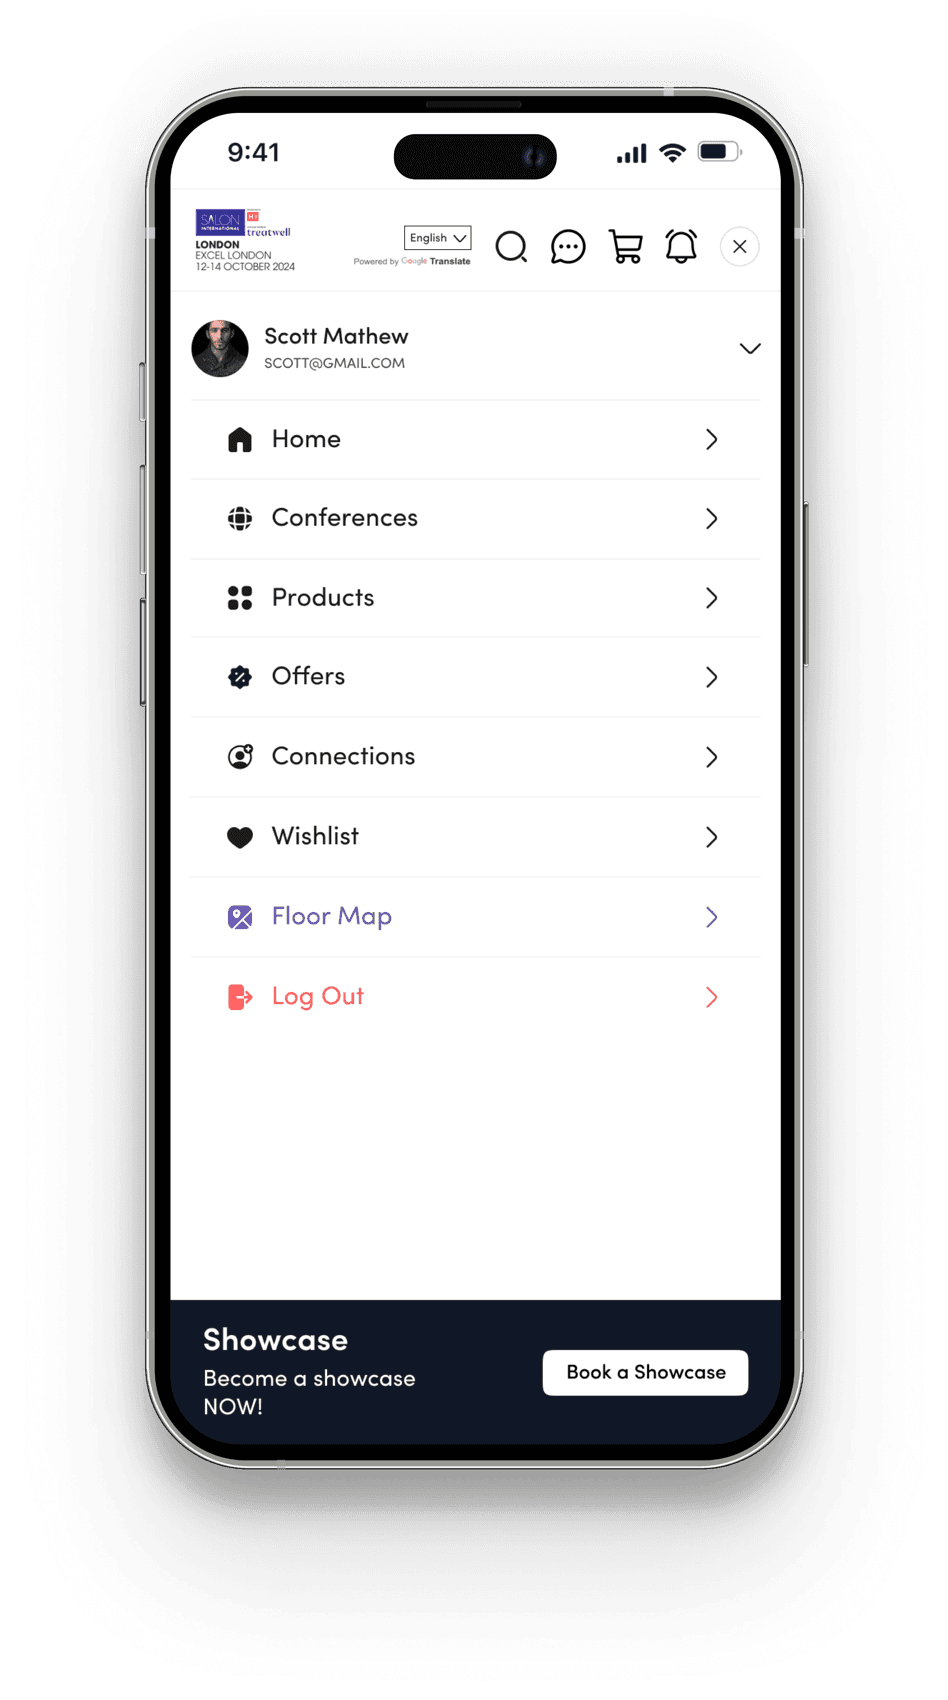
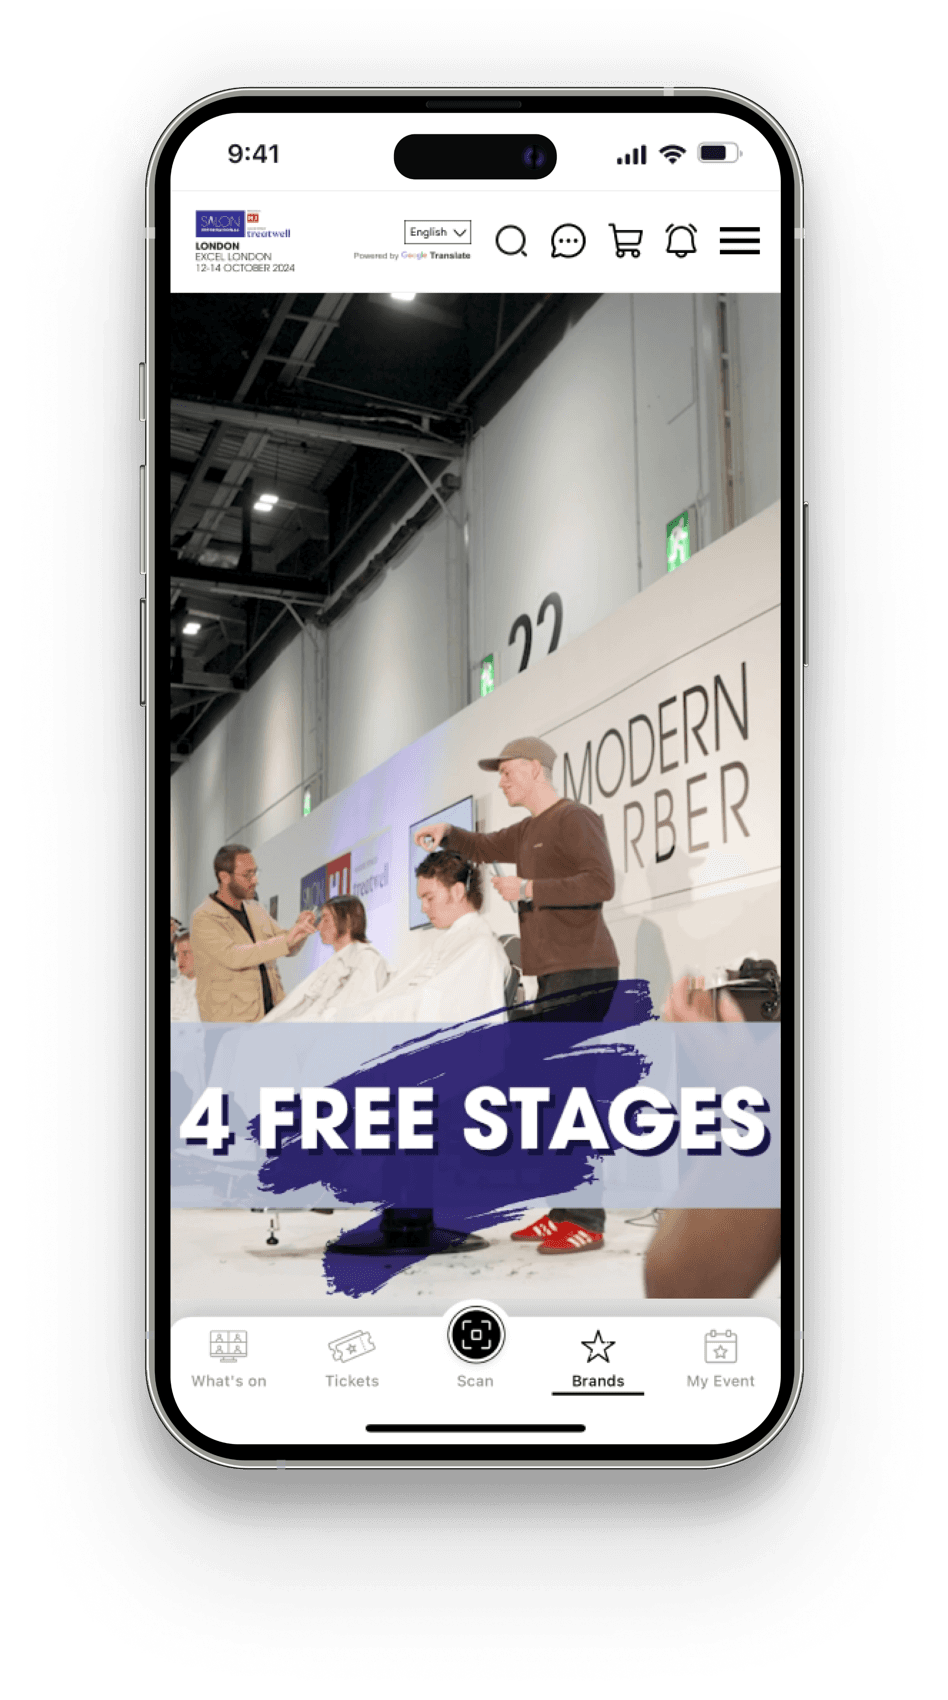
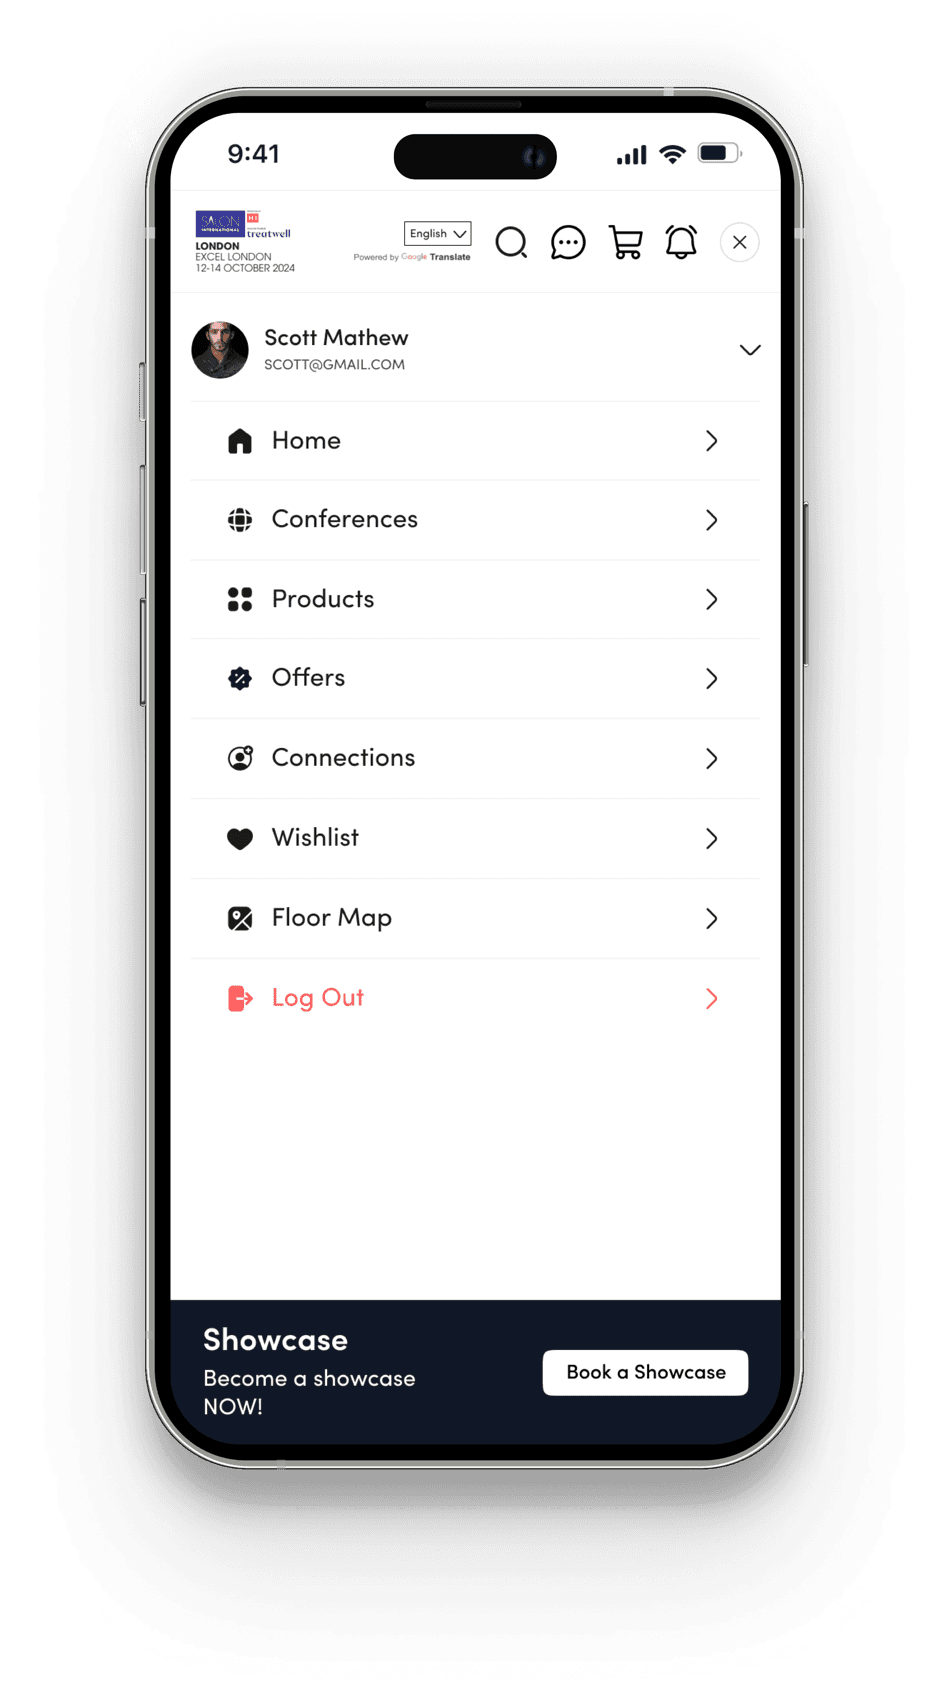
  1. We will implement a clear and intuitive navigation structure to ensure all features are easily accessible.
  2. The enhanced menu bar will highlight key features.
  3. All features will be prominently displayed on the landing page to increase visibility and improve user experience.
Old Navigation Structure
Showhub screen: Old navigation structure (mobile).Showhub screen: Old navigation structure (mobile).
New Navigation Structure
Showhub screen: New navigation structure (mobile).Showhub screen: New navigation structure (mobile).
  • Pain causing - High
  • Effort to fix - Medium
  • User type - Both

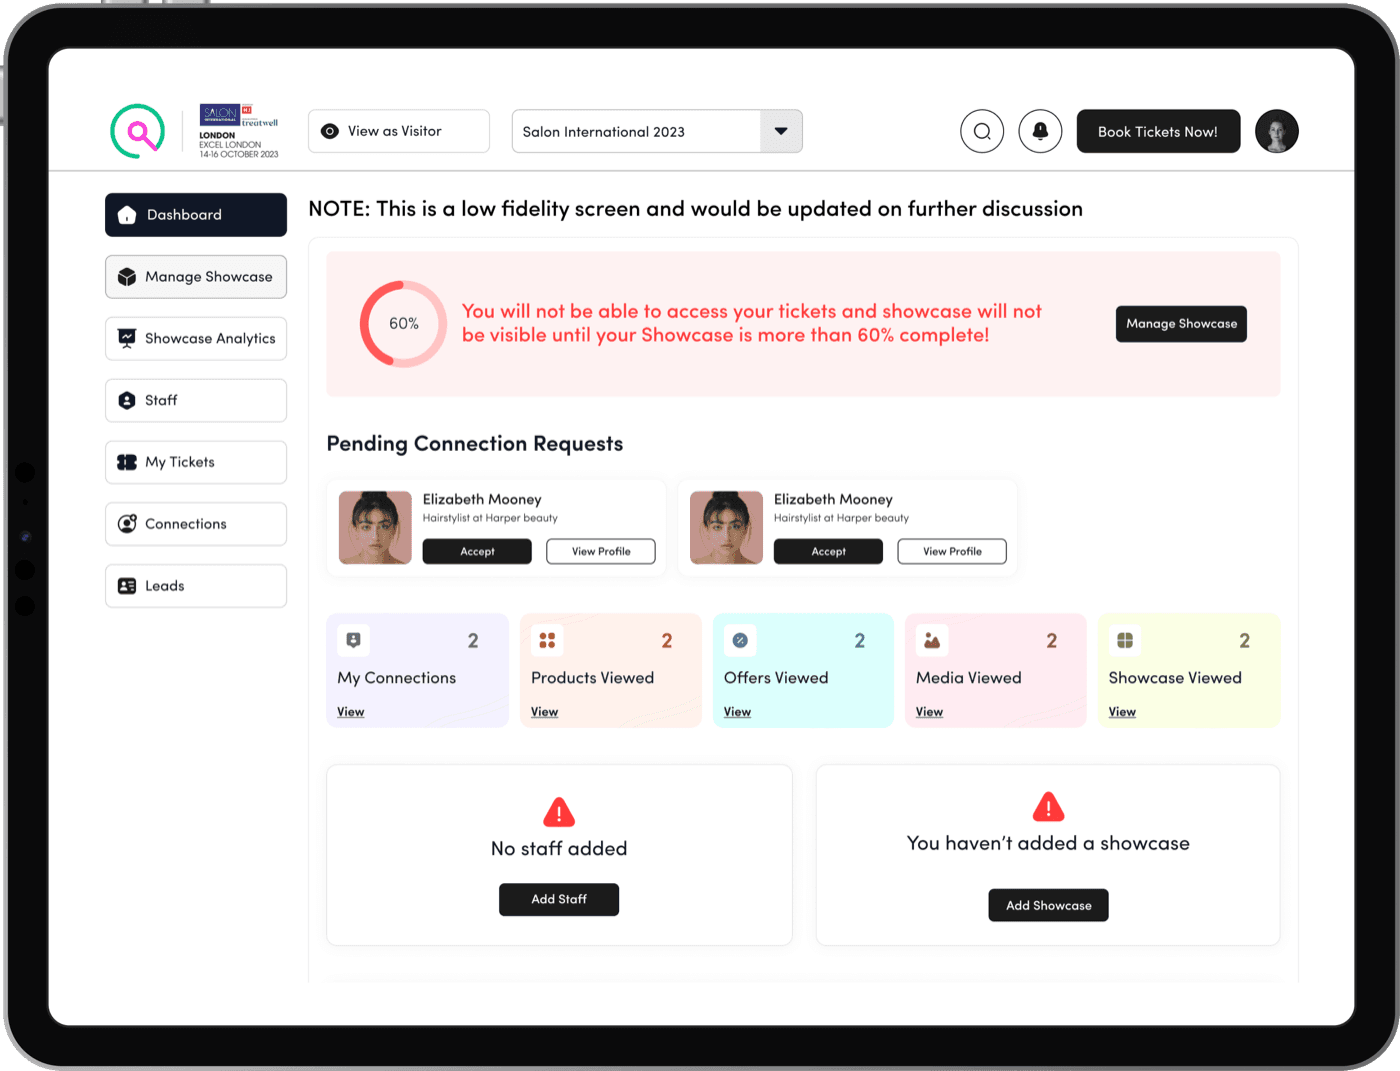
10Showcase Incomplete: Addressing Unfinished Showcases to Boost Visibility and Engagement

Pain Points (Showcase Incomplete)

Showcase holders are starting the process of creating showcases but are leaving them incomplete.

Repercussions (Showcase Incomplete)

Incomplete showcases result in limited visibility of content, leading to reduced engagement from visitors and a platform that appears underutilized. This diminishes user trust and satisfaction, creating frustration and a lack of confidence in the platform's value.

Solution (Showcase Incomplete)

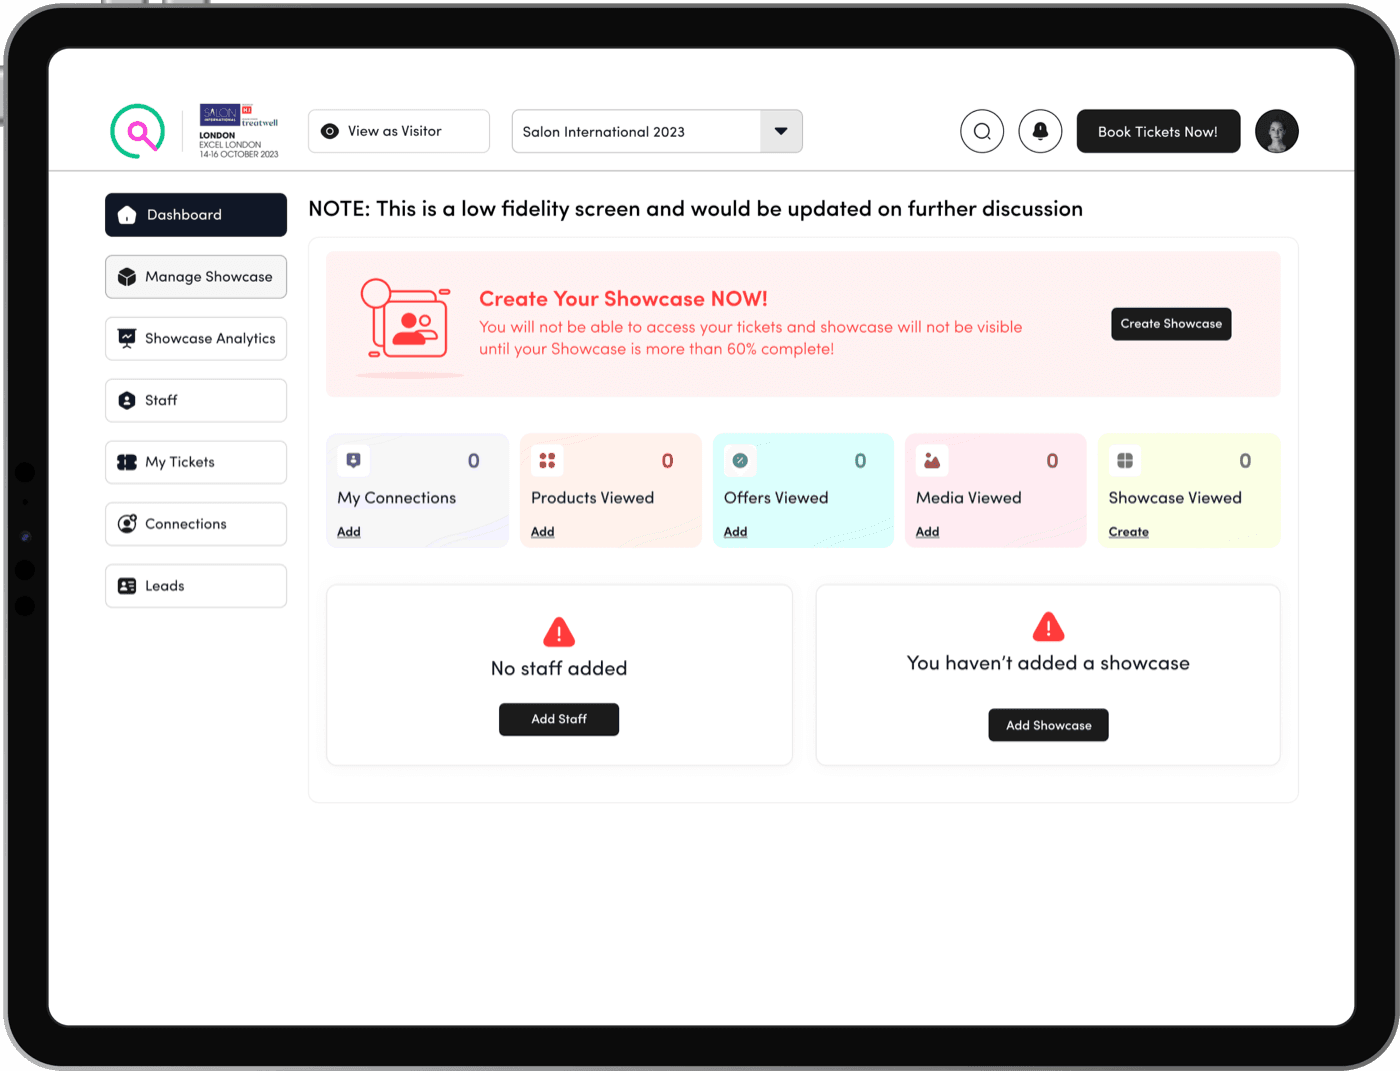
  1. Implement a system that issues a warning to showcase holders if their showcase is less than X% complete. In such cases:
  2. They will lose access to tickets until the required completion level is met.
  3. Showcase will not be visible.
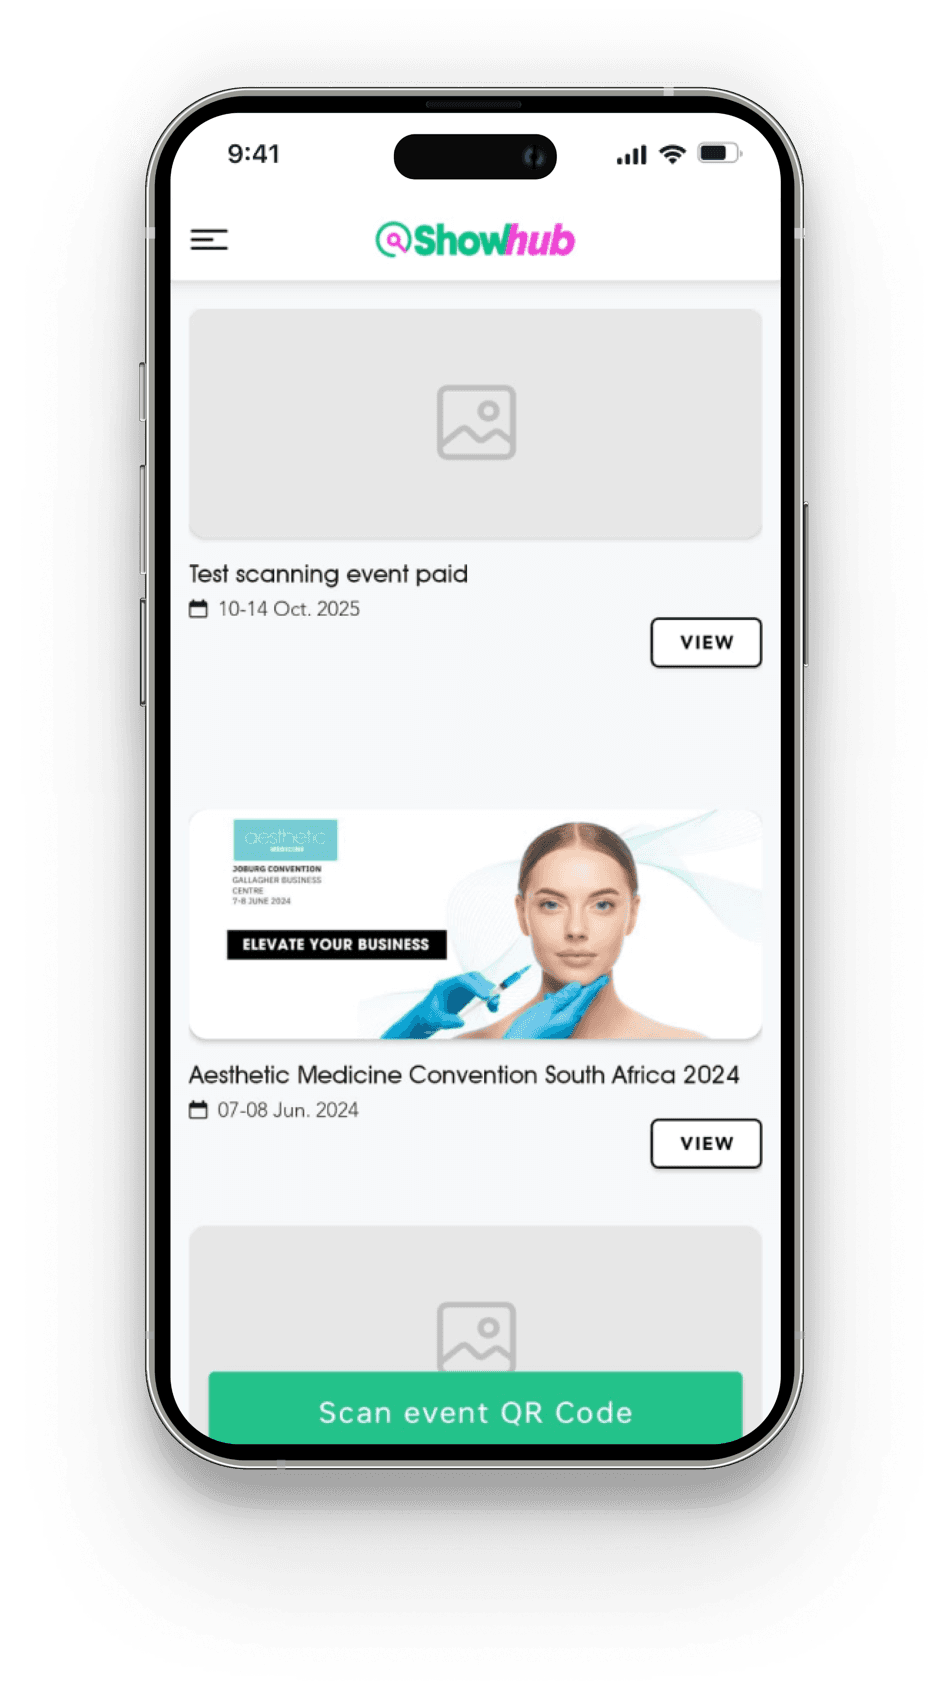
Before Creating Any Showcase - State
Showhub screen: Before creating any showcase.
After Creating A Showcase - State
Showhub screen: After creating a showcase.
  • Pain causing - High
  • Effort to fix - Low
  • User type - Exhibitor

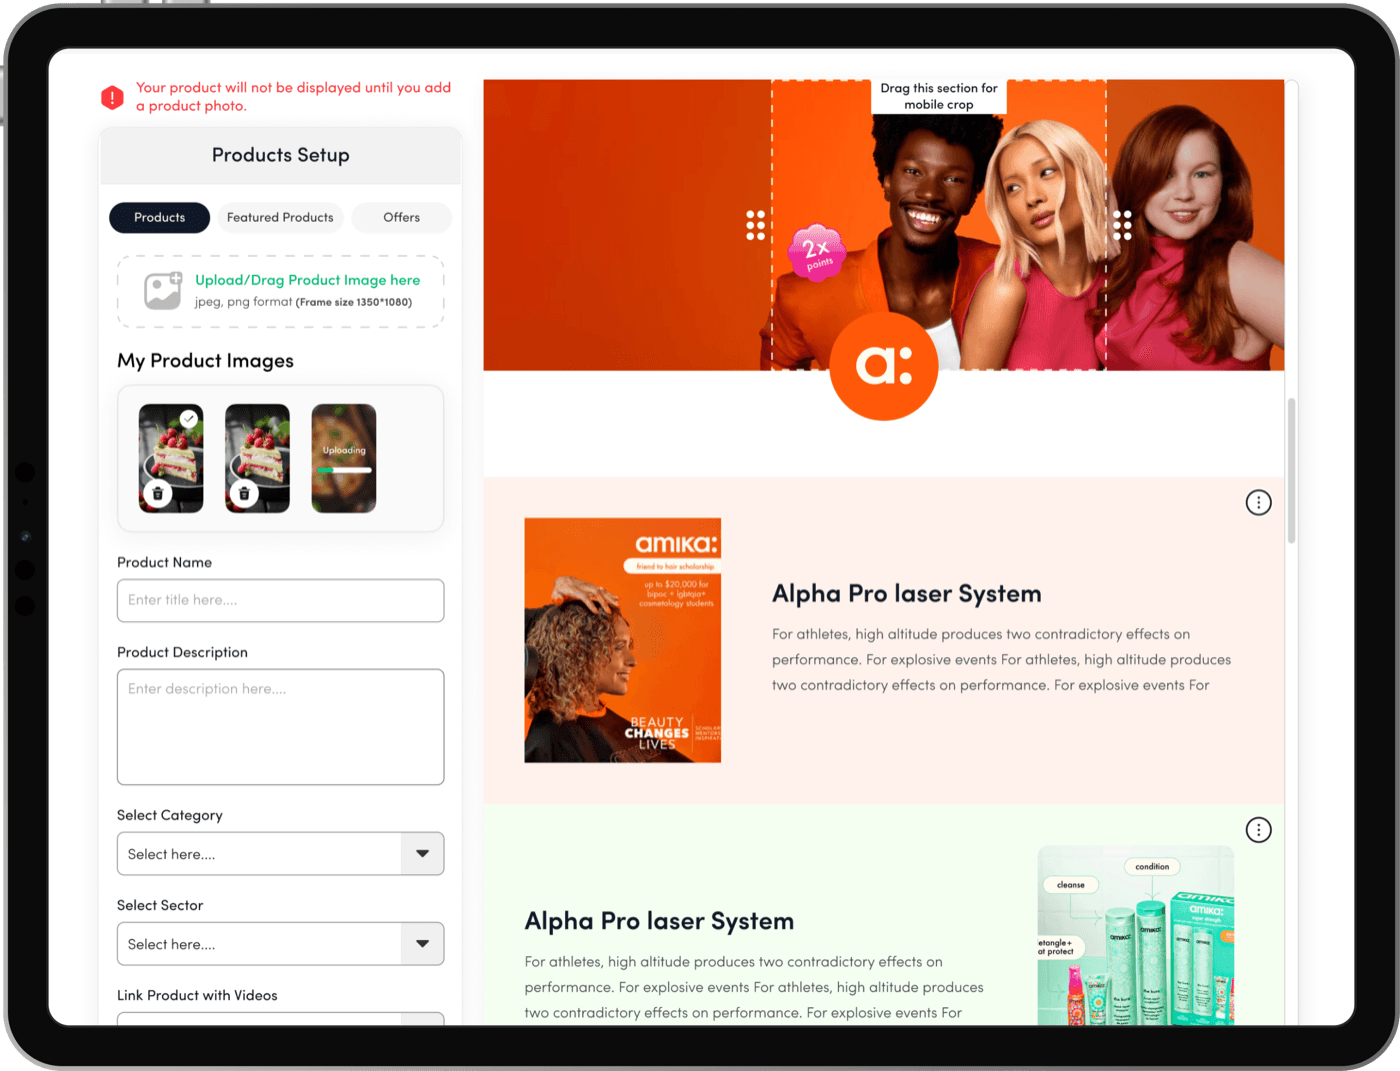
11Ensuring Complete and Consistent Product Listings by Making Image Upload Mandatory

Pain Points (Data/Information)

Brands are not consistently uploading product images when adding products to their showcases.

Repercussions (Data/Information)

Missing or blank product images lead to incomplete listings, making the platform look unprofessional and poorly maintained. This can result in users feeling disappointed, confused, or skeptical about the platform's credibility.

Solution (Data/Information)

Make it mandatory to upload a product image when adding a new product to the showcase, ensuring all entries are complete and visually consistent.
Showcase Setup Screen
Showhub screen: Showcase setup.
    1. All exhibitors will upload product images of the same dimensions to ensure uniformity.
    2. A warning message will appear if an exhibitor tries to save the brand products without uploading a brand image.
    3. Uploaded products can be managed directly from this section.
  • Pain causing - High
  • Effort to fix - Low
  • User type - Exhibitor

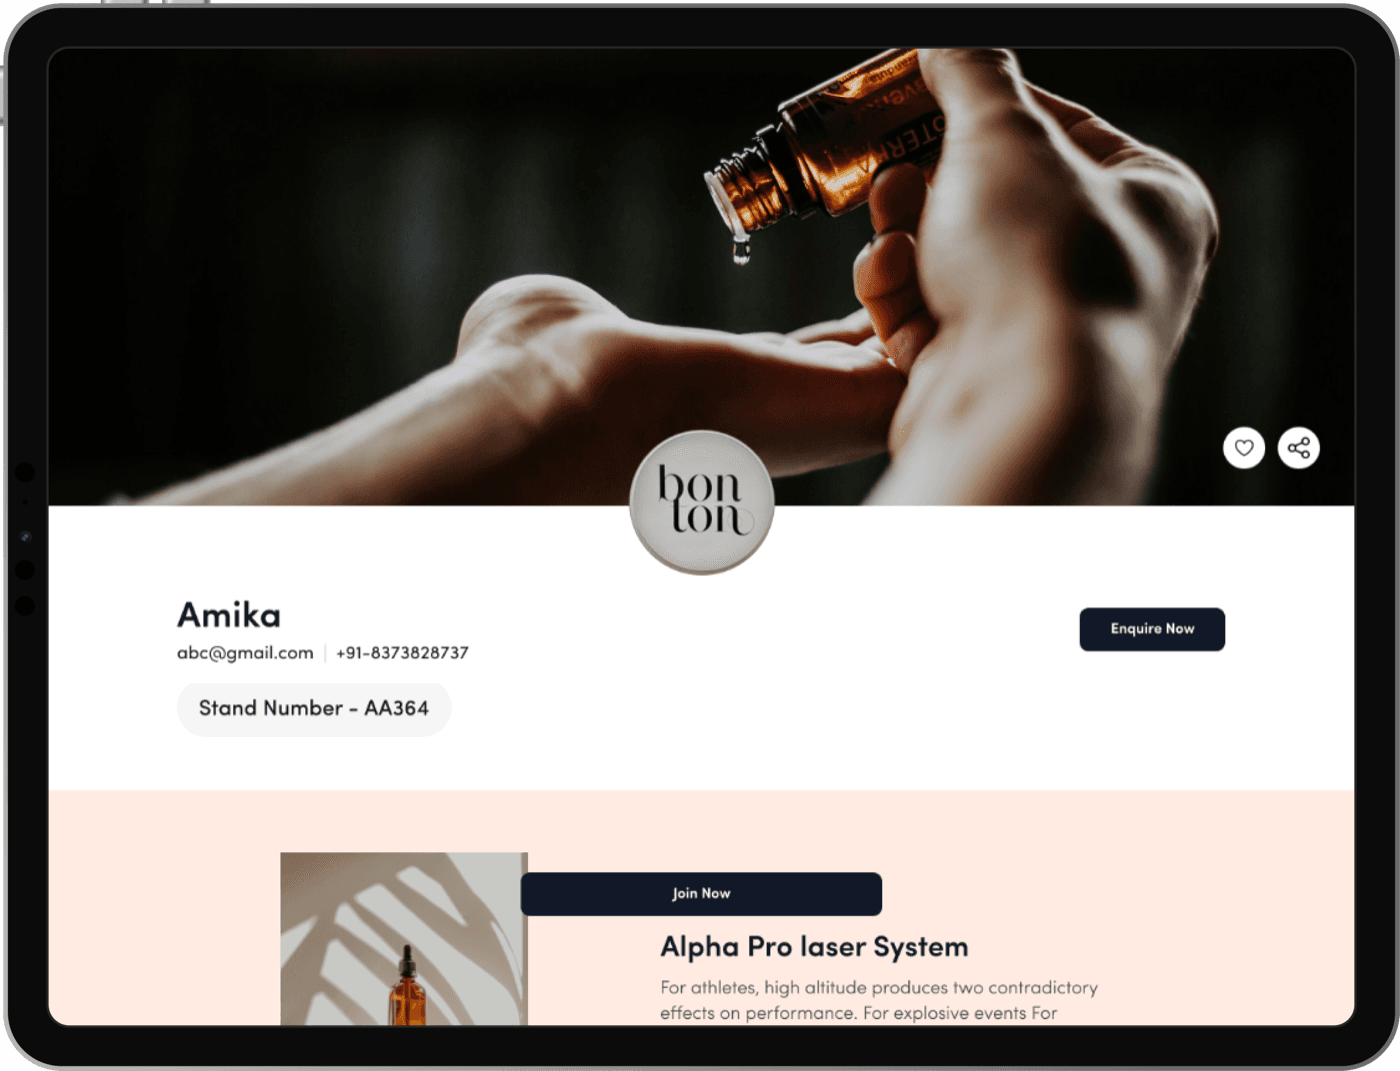
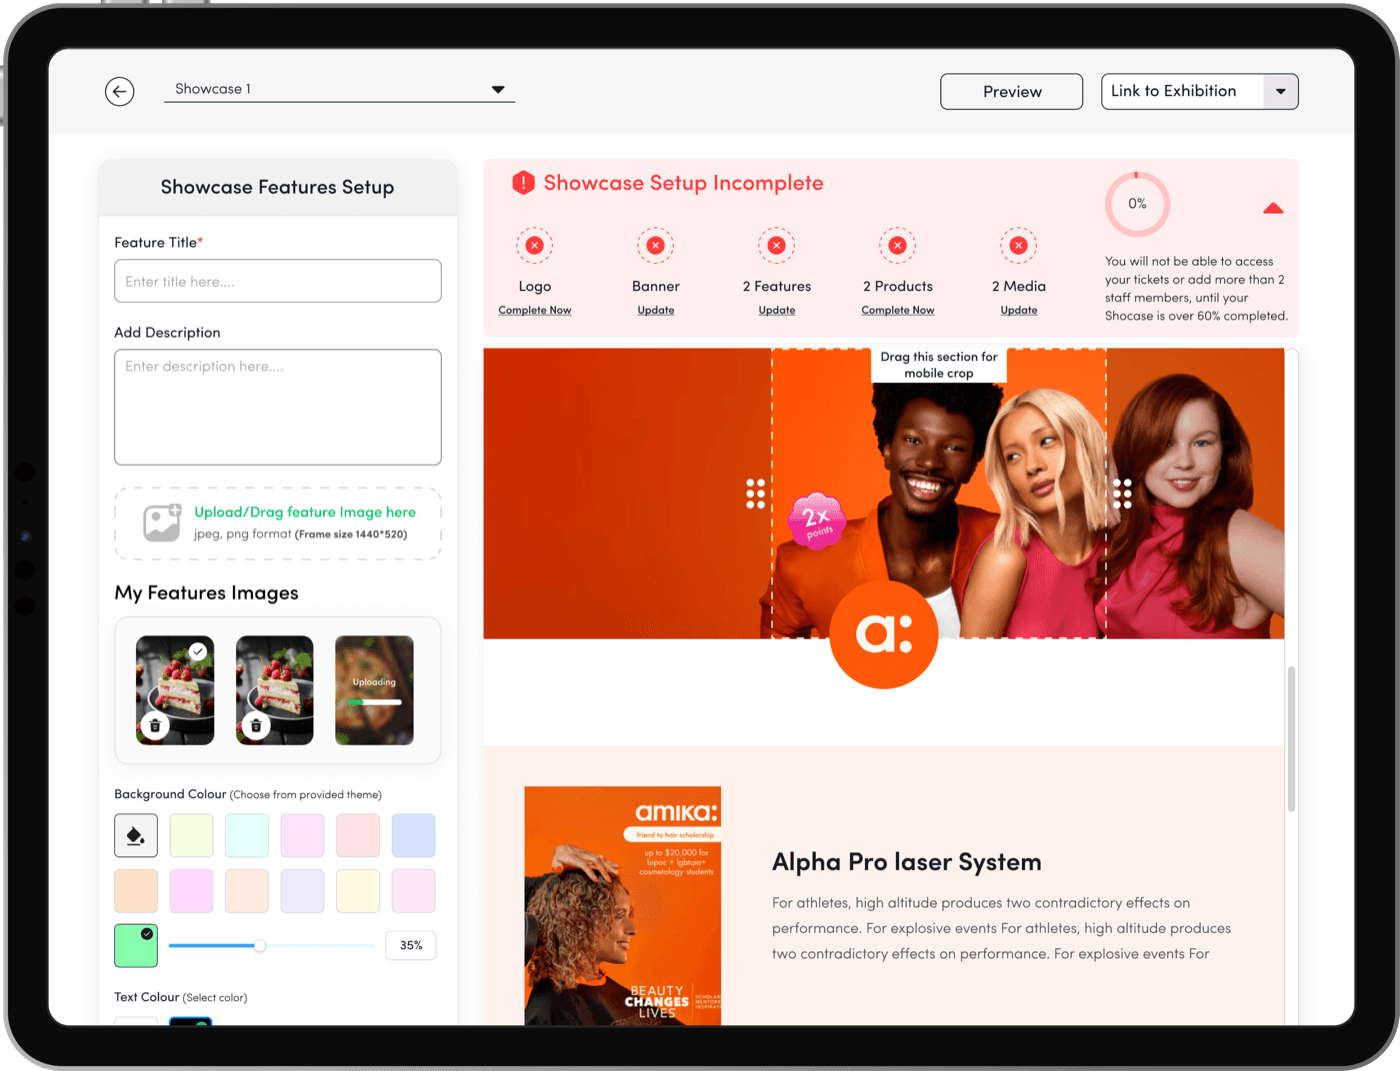
12Revamping Showcase Setup: Enhancing Brand Landing Page Design and Functionality for Increased Engagement and Branding

Pain Points (Showcase Setup)

The showcase profile page has an outdated design, offering limited information and functionality.

Repercussions (Showcase Setup)

Exhibitors are less motivated to upload information to their showcase profiles because the page lacks visual appeal and branding options. As a result, the platform may not fully showcase their products or services, leading to reduced engagement and poor user satisfaction.

Solution (Showcase Setup)

  1. Reevaluate the UI to enhance its design and usability.
  2. Make the page much easier to set up, with preview options for mobile and web.
  3. Allow for header image customization to enable better branding.
  4. Integrate discover to provide richer content.
  5. Offer customisable theme selections to align with brand identities.
  6. Preview of how mobile will crop header images.
Showcase Landing Page (Web View)
Showhub screen: Showcase landing page (web view).Showhub screen: Showcase landing page (web view).
  • Pain causing - High
  • Effort to fix - High
  • User type - Exhibitor

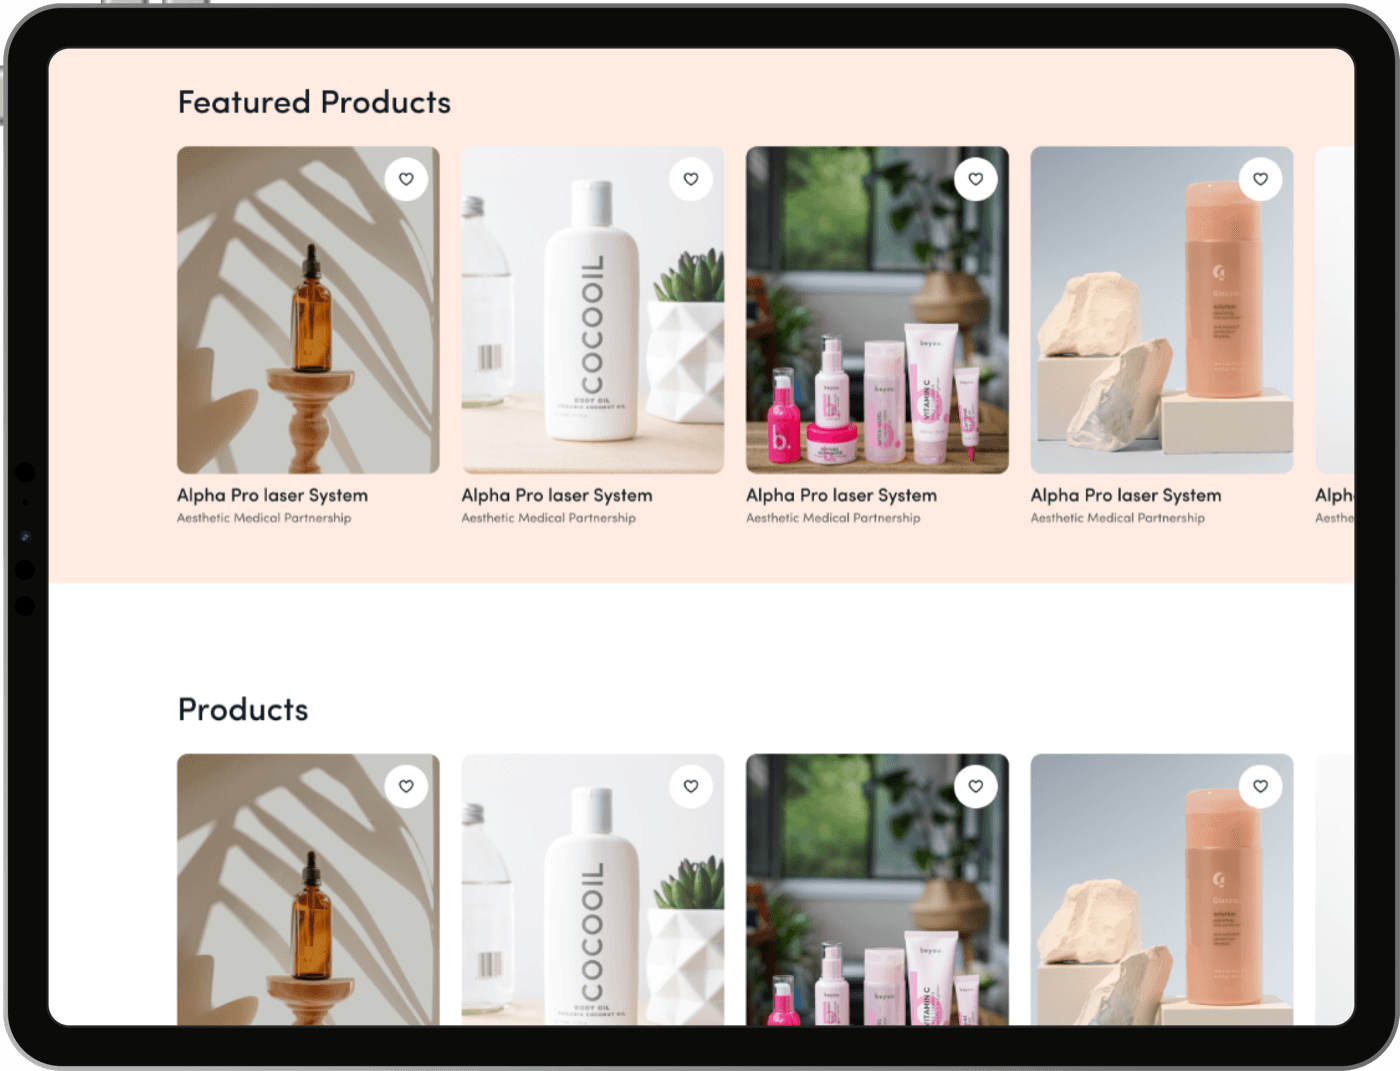
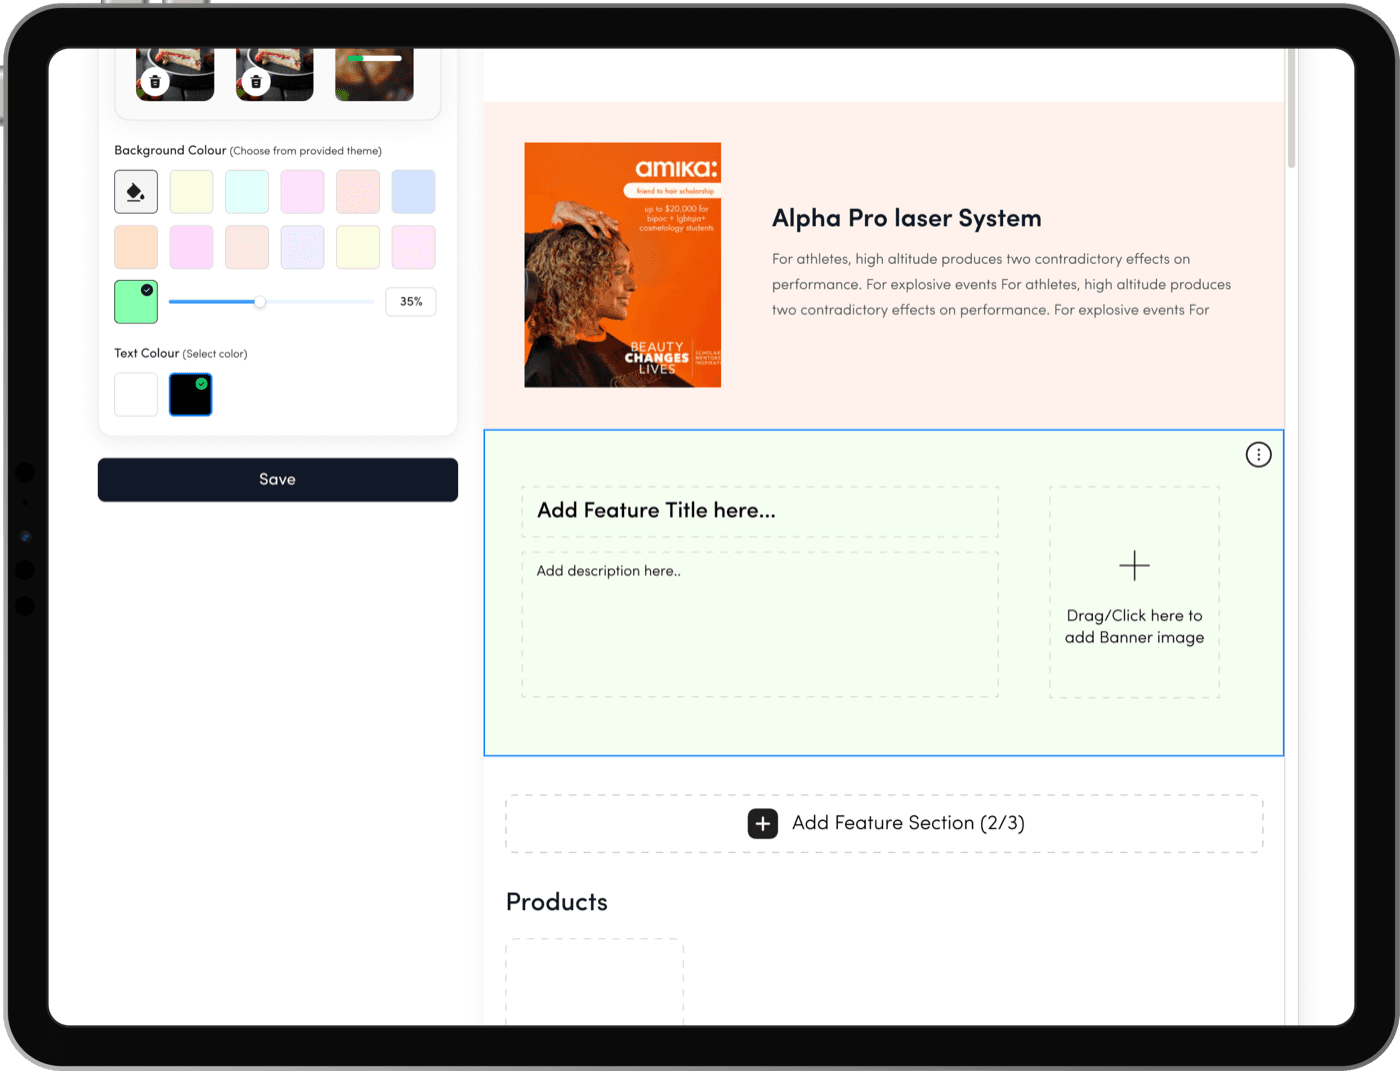
13Revamping Showcase Setup: Redesigning Pages for Greater Flexibility and Engaging Brand Storytelling

Pain Points (Showcase Setup)

Brand showcases are bland. Brand showcases lack engaging design and sufficient customization options, preventing showcase holders from effectively communicating their brand story or unique concepts.

Repercussions (Showcase Setup)

The lack of flexibility and appeal in showcase pages leads to reduced enthusiasm among showcase holders to upload content, resulting in incomplete or uninspiring showcases.

Solution (Showcase Setup)

  1. Redesign the showcase page to help brands highlight their unique selling points more effectively.
  2. Allow up to three customizable sections with a title, image, and description for a more dynamic presentation.
  3. Require at least one completed section to ensure the showcase is visually ready while offering flexibility to add up to three.
Feature Add/Edit Screen (Showcase Setup Editor)
Showhub screen: Showcase setup editor.Showhub screen: Showcase setup editor.
  • Pain causing - Medium
  • Effort to fix - High
  • User type - Exhibitor


5.Impact Conclusion Findings

Once the research was completed, recurring patterns became clear: users weren’t struggling because the platform lacked features—they were struggling because those features were hard to find, unclear, or incomplete. This insight shaped the direction of the ideation phase.

We organised all findings into key problem areas such as navigation, ticket management, showcase completion, feature discoverability, and content quality. From these, we defined guiding design principles: simplify navigation, surface important actions at the right moment, support completion over access, and create one seamless pre-event, onsite, and post-event experience.

Using these principles, we began sketching multiple solutions. Low-fidelity wireframes helped validate user flows, while high-fidelity versions refined clarity, hierarchy, and UI consistency. Quick-win enhancements were prioritised first, followed by larger structural changes such as a redesigned ticket flow, improved search, and a more intuitive showcase setup.

Conclusion:

The ideation phase transformed fragmented feedback into a clear, solution-focused vision. Every design decision was grounded in user insights, ensuring the platform evolved into a more intuitive, discoverable, and engaging experience.

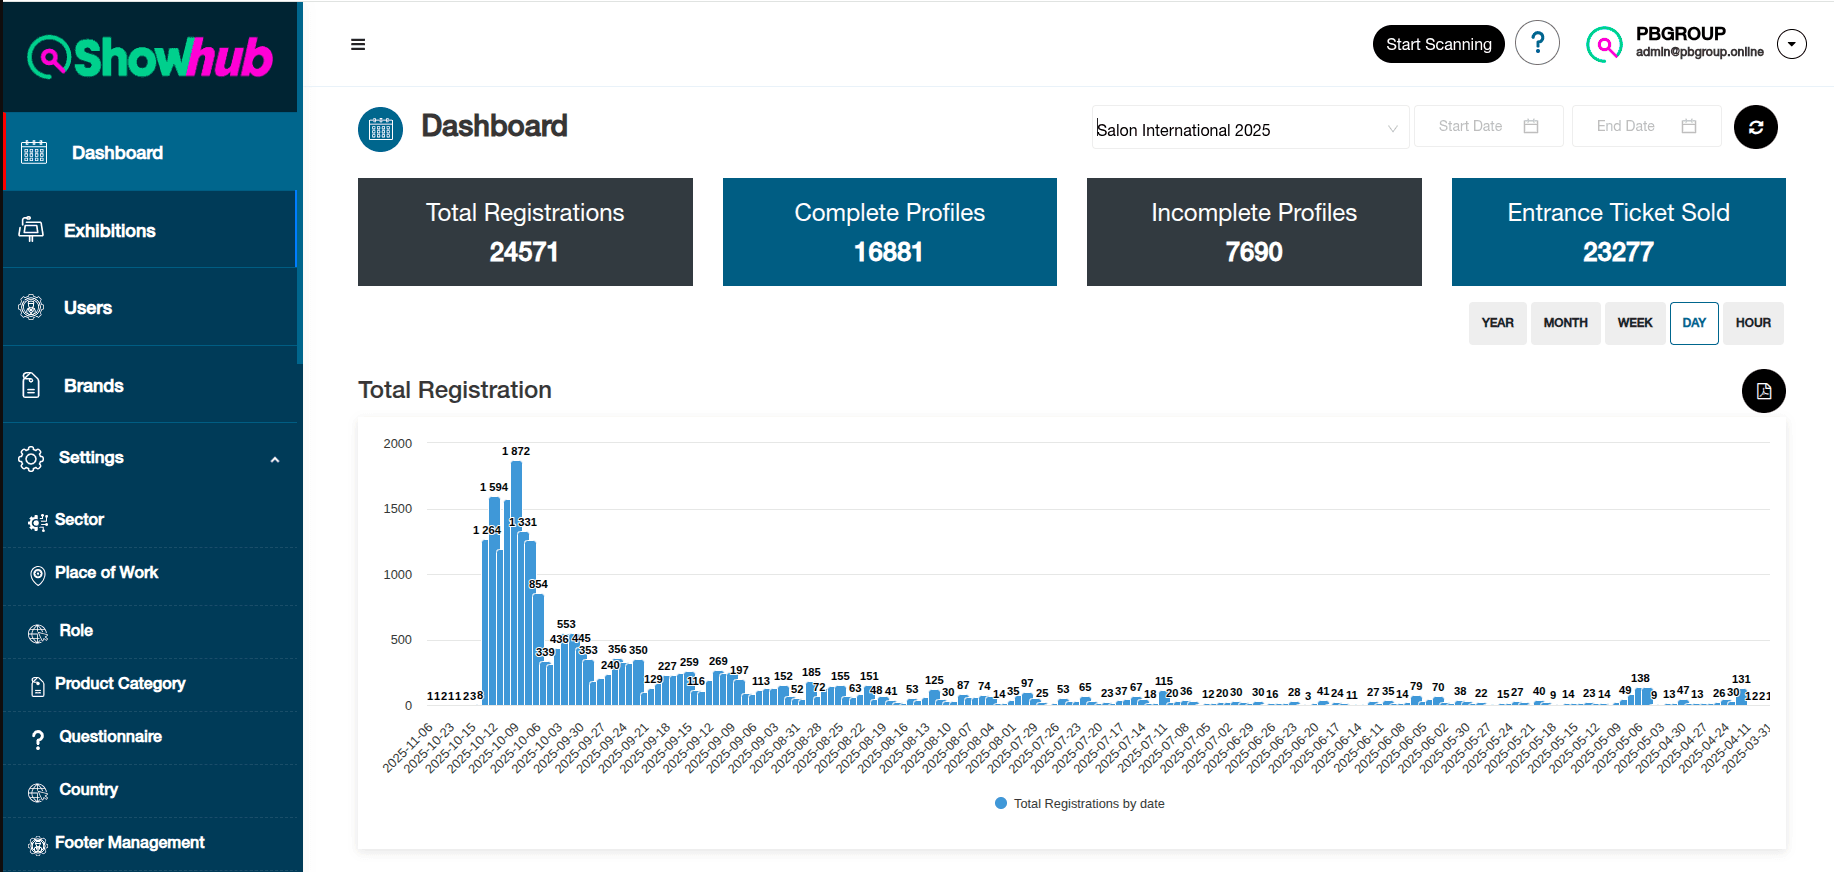
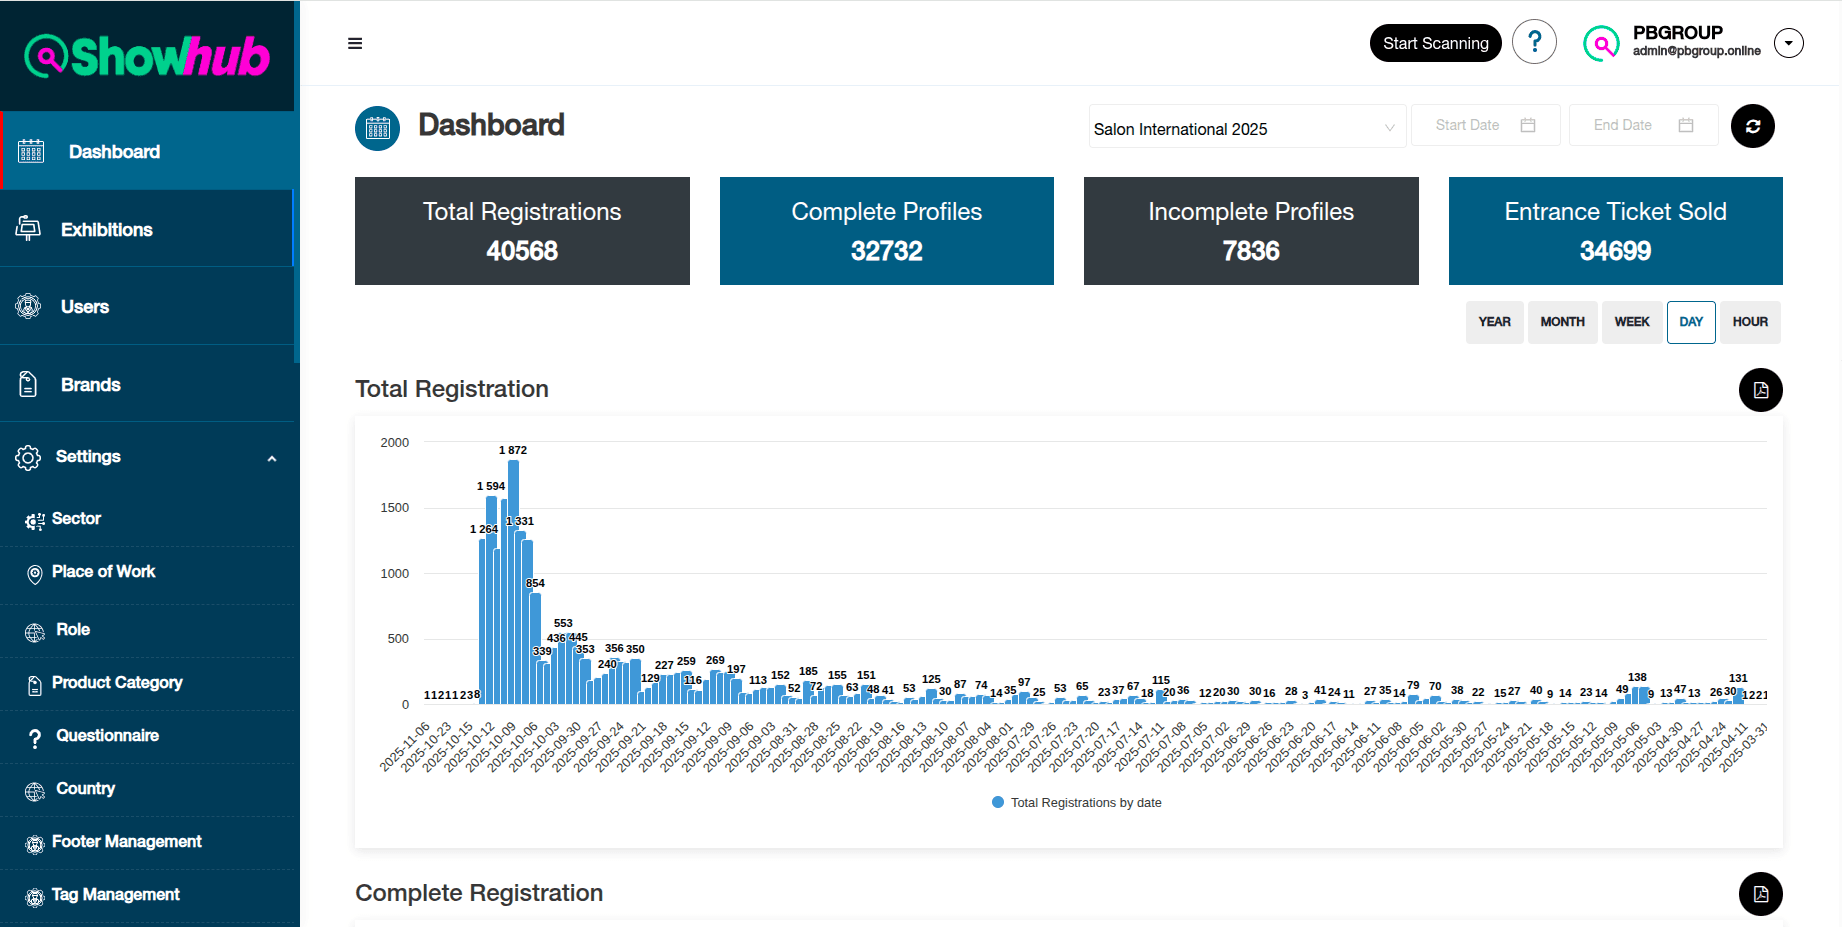
Impact
Before UX Redesigning
Dashboard before the UX redesign: Total Registrations 24571, Complete Profiles 16881, Incomplete Profiles 7690, Entrance Ticket Sold 23277.
After UX Redesigning
Dashboard after the UX redesign: Total Registrations 40568, Complete Profiles 32732, Incomplete Profiles 7836, Entrance Ticket Sold 34699.

6.Deliverables

  1. User Research Findings.
  2. Proposed Solutions design file
  3. 57 page product journey documentation.

6.Learnings

  1. Understanding business objections.
  2. How to align with the core of the projects.
  3. How to emphasise with users.
  4. Keeping each & every team member on the same page.
  5. How to shape an end-to-end product.
  6. Using UX Research tools.
  7. Analysis of the research data.
  8. Ideation.

Thank You For Your Time 😊